Uterine fibroids can affect up to 80% of women by age 50. Endometriosis affects 1 in 10 women of reproductive age. Together, they are two of the leading conditions among reproductive-aged women causing infertility, chronic pelvic pain, fatigue, nausea, and heavy menstruation. Symptoms of uterine fibroids and endometriosis are also associated with abdominal pelvic pain, heavy and painful menstruation, internal non-inflammatory disorders, and menstruation and infertility conditions. The wide overlap of symptoms across conditions means that women may wait months to years to receive an accurate diagnosis, leading to significant under- and misdiagnosis.
In this brief, we examined the rates of the following conditions:
- Abdominal pelvic pain
- Endometriosis
- Heavy and painful menstruation
- Internal non-inflammatory disorders
- Menstruation and infertility conditions
- Uterine fibroids
Together, we refer to these as “non-cancerous gynecological conditions.” Using HCCI data, which includes over one-third of the population who get health insurance through work, we examined the rate of these diagnoses in 2021 and how these rates varied by age and social vulnerability of where people live (measured by the Minority Health Social Vulnerability Index, or MH-SVI). For this analysis, we used a metric that captures the rate of health care encounters with a diagnosis of each condition. Encounters can include doctors visits, outpatient procedures, inpatient hospitals stays – any time a person interacts with the health care system. During those encounters, a diagnosis (or diagnoses) is recorded. This brief tracks encounters during which a non-cancerous gynecological condition diagnosis was noted as a way to measure the frequency of health care use among people with those diagnoses.
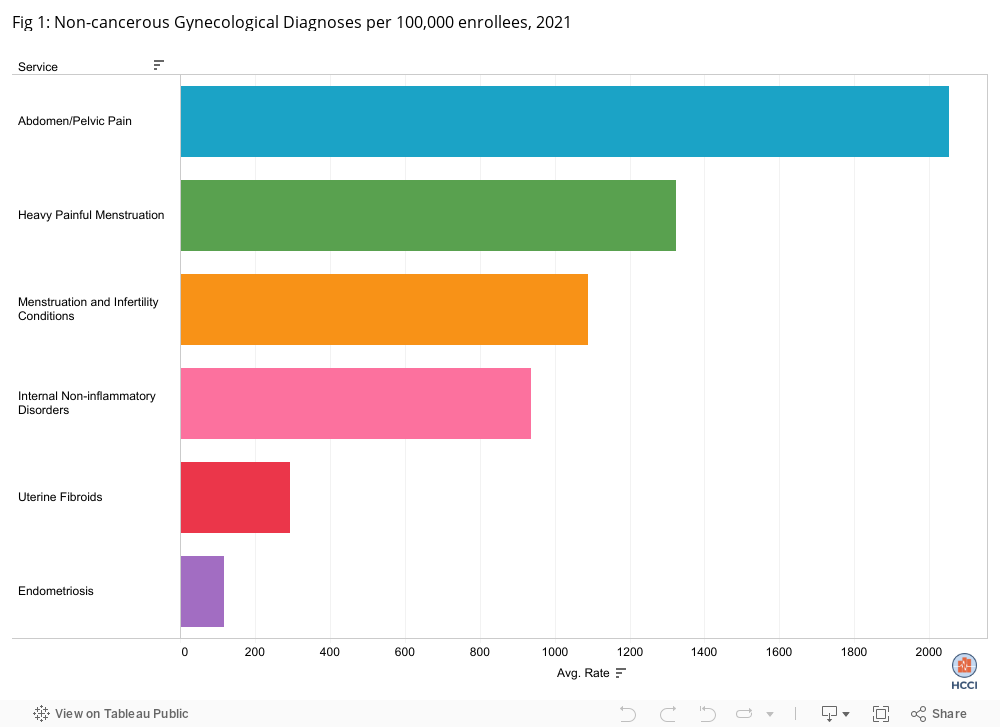
Abdominal Pelvic Pain and Heavy Painful Menstruation were the Most Common Conditions in 2021
Overall, in 2021, there were 4,968 health care encounters with a non-cancerous gynecological condition diagnosis per 100,000 enrollees each month on average. For example, there were 2,000 encounters with a diagnosis of abdominal pelvic pain per 100,000 enrollees each month in 2021 on average. As shown in Figure 1, this was the most frequent non-cancerous gynecological condition in the HCCI data in 2021. Heavy painful menstruation was the next most common type of encounter at a rate of over 1,300 per 100,000 enrollees each month.
Encounters with a uterine fibroid diagnosis averaged 293 encounters per 100,000 enrollees per month, and encounters with an endometriosis diagnosis averaged 116 per 100,000 enrollees per month. Because non-cancerous gynecological conditions have similar symptoms, it is possible that individuals with an abdominal pelvic pain or heavy painful menstruation diagnosis were later diagnosed with uterine fibroids or endometriosis or had those conditions but were undiagnosed or misdiagnosed.
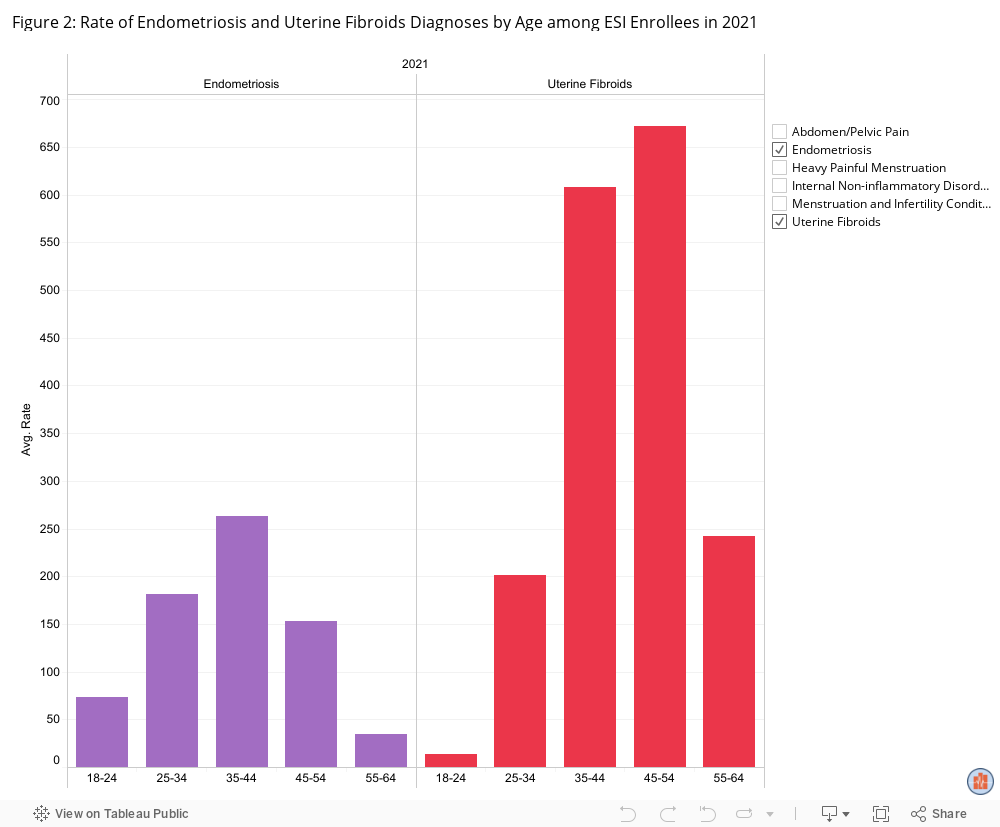
Women between 35 and 44 Had the Highest Rates of Non-Cancerous Gynecological Conditions
Looking across all conditions, women aged 35 to 44 had the highest rates of encounters at over 7,000 per 100,000 enrollees in 2021. All non-cancerous gynecological conditions peak between the ages of 25 and 54, although the specific age band where diagnosis is highest varies by condition. For example, the highest average rate of encounters with a uterine fibroids diagnosis was among women aged 45-54 (672 per 100,000 on average per month). In contrast, the highest average rate of encounters with an endometriosis diagnosis was among women aged 35-44 (263 per 100,000 on average per month). These findings align with the literature that indicates that endometriosis is most prevalent among reproductive-aged women, less common post-menopause, and that the prevalence of uterine fibroids declines as women enter menopause.
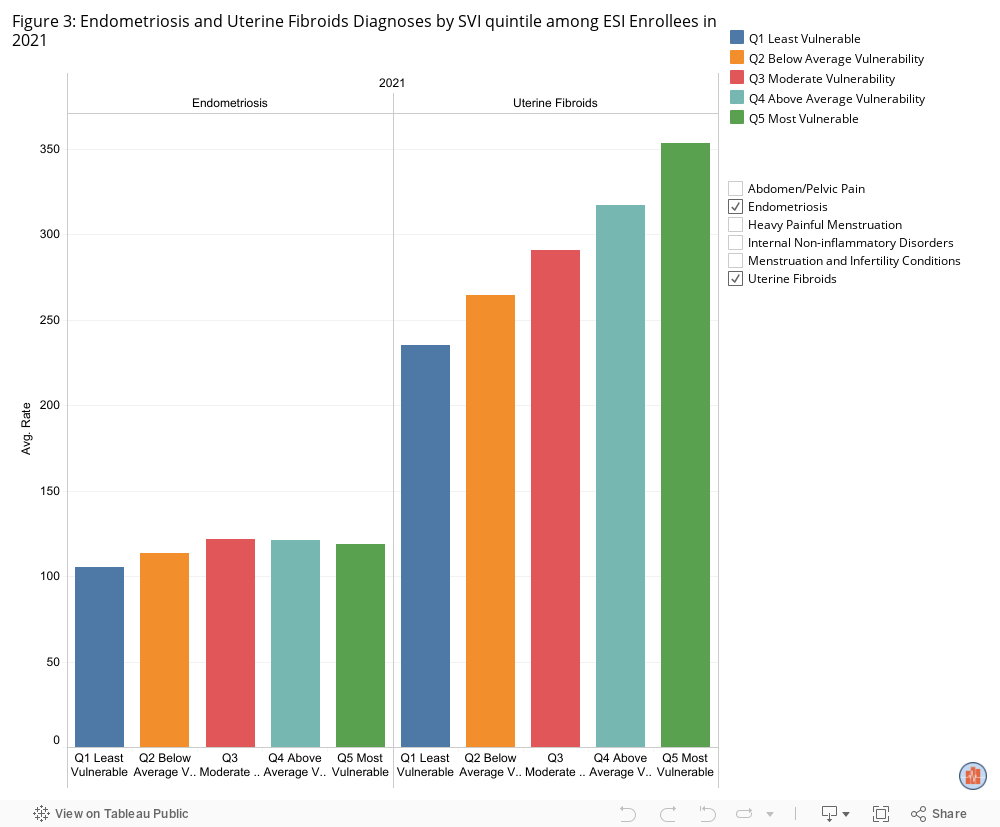
Endometriosis and Uterine Fibroid Diagnoses are Highest among those Living in the Most Socially Vulnerable Areas
Uterine fibroids disproportionately affect Black women, who are three times more likely to be diagnosed with the condition than those in other racial groups. Although endometriosis exhibits fewer distinct racial disparities in prevalence, disparities persist in diagnosis, treatment, access to care and surgical outcomes. Our claims data do not include fields for race or ethnicity, but earlier HCCI work has documented health care disparities using the Minority Health Social Vulnerability Index (MH-SVI). In this analysis, we examined health care encounter rates by MH-SVI to determine whether there are disparities in non-cancerous gynecological conditions.
Across all the conditions studied, the highest diagnosis rate is among the most vulnerable zip codes(Q5); inversely the least vulnerable zip codes (Q1) had the lowest diagnosis rates. Generally, that pattern holds for each individual condition as well. As shown in Figure 3, the rate of health encounters for endometriosis in 2021 was lowest in the least vulnerable areas (Q1) with an average monthly rate of 105 per 100,000. Comparatively the average rate of endometriosis health encounters was highest among zip codes categorized as Q3, Q4, and Q5 at nearly 122 per 100,000, 121 per 100,000, and 118 per 100,000 encounters, respectively. Similarly, the average rate of uterine fibroid health encounters was highest in more socially vulnerable areas and lowest in less socially vulnerable areas, at an average rate of 353 per 100,000 for those in Q5 compared to nearly 235 per 100,000 in Q1.
Menstruation and infertility conditions were the exception to the pattern observed for non-cancerous gynecological conditions overall. For those conditions, our data show higher rates of health encounters in the least vulnerable areas (Q1) at 1,200 encounters per 100,000 enrollees and lower rates in the most vulnerable areas (Q5) at 971 encounters per 100,000 enrollees.
Claims Data Allow Important Insights into Diagnosis of Endometriosis and Uterine Fibroids; Additional Research and Analyses are Required to Capture the Full Journey and Impact of these Conditions
Access to adequate gynecological care and the journey to receive an accurate diagnosis can be affected by multiple factors including insurance coverage, resources at nearby health care providers, affordability, state policies, and individual experiences. In addition to access and quality of care, there are significant racial disparities in the prevalence and incidence of non-cancerous gynecological conditions. Increasing awareness of non-cancerous gynecological conditions is important given the significant physical, economic, and emotional burden they impose.
While this analysis does not capture the full picture of endometriosis and uterine fibroids within the health care system — it is limited to ESI enrollees whose diagnoses generated a claim during our timeframe and therefore does not capture underlying prevalence of these conditions or those that remain undiagnosed – these findings provide us with descriptive, timely data furthering the conversation about gynecological care and diagnosis of these conditions.
Methods
The purpose of this study is to provide a descriptive analysis of how many women in the ESI population have endometriosis and uterine fibroids reported on health encounters in 2021 and how this varies by age and MH-SVI. We grouped all remaining non-inflammatory disorders of the female genital tract based on diagnosis codes. The first group includes diagnoses related to internal physical abnormalities of the female genital tract (prolapse, fistulae, polyps, dysplasia, cysts, torsion). The second group includes diagnoses related to irregular or lack of menstruation (amenorrhea, oligomenorrhea, menopause) and infertility complications (pregnancy loss, complications with artificial fertilization) and abnormalities in external genital structures. For simplicity the first group will be called “internal non-inflammatory disorders” and the second group “menstruation and infertility conditions”.
We identified the rate of healthcare encounters with a diagnosis of abdomen/pelvic pain, painful or heavy menstruation, endometriosis, uterine fibroids, internal non-inflammatory disorders, and menstruation and infertility conditions among women aged 18-64. Please note that more than one diagnosis for a non-gynecological condition may have occurred within the same health encounter. This study focuses on women as it aligns with the data we have access to. However, this brief acknowledges that all individuals with uteri may also experience these conditions.
To examine the disparities associated with endometriosis and uterine fibroids, we linked our dataset with the CDC’s Minority Health Social Vulnerability Index (MH-SVI) stratified by quintiles of lowest vulnerability (Q1) to highest vulnerability (Q5)., which can be used to apply a health equity lens to research.