It is well-established that the rates hospitals and physicians are paid to provide health care services are significantly lower in Medicaid than in private health insurance. In this brief, we provide new data on this payment gap in the context of childbirth, an especially relevant area of care since Medicaid and ESI together cover the vast majority of births in the United States. We used HCCI’s unique commercial claims dataset and data from the Transformed Medicaid Statistical Information System (T-MSIS) from the Centers for Medicare and Medicaid Services to compare the average payment for childbirth among birthing people with fee-for-service (FFS) Medicaid coverage and those with employer-sponsored health insurance coverage (ESI).
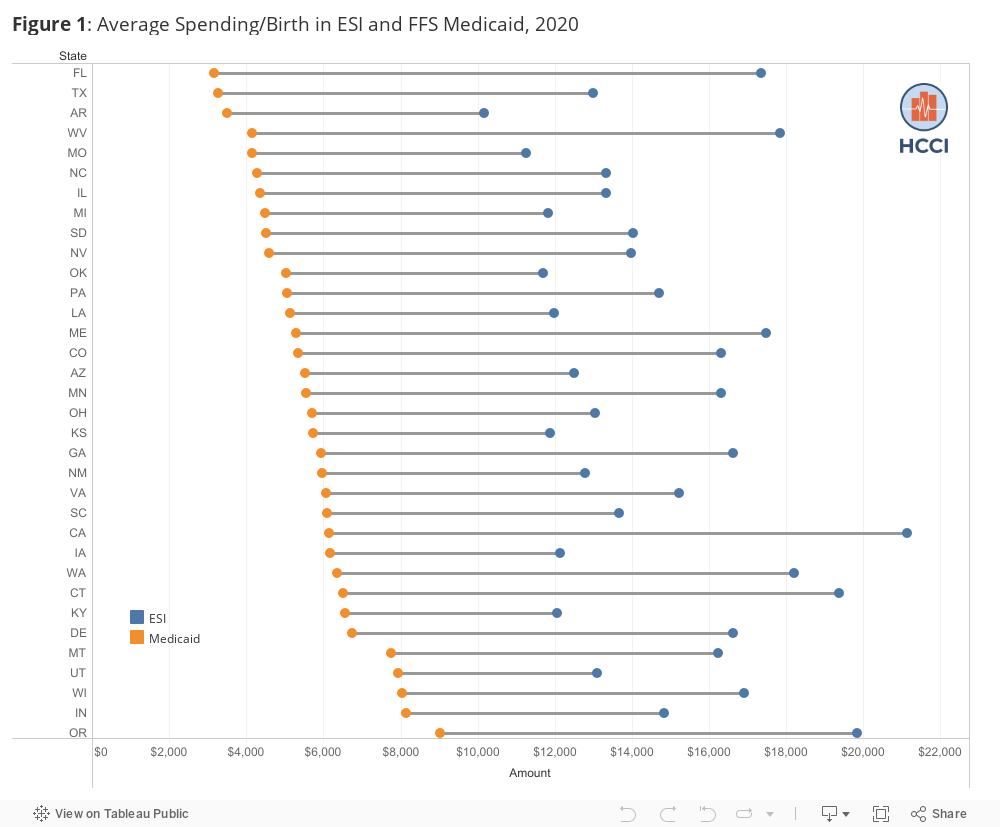
We present data on childbirth payment in ESI and FFS Medicaid in 38 states for which we have reliable payment data for both types of payers (please see Methodology for details). Our data show that the average ESI payment for childbirth was greater than the average FFS Medicaid payment for childbirth in all 38 states, with an average difference of $8,732 for all deliveries, $11,084 for c-section deliveries, and $7,461 for vaginal births. The figure below shows that the difference between average payment per birth in ESI and FFS Medicaid ranged from almost $2,000 in New York to over $15,00 in California. Differences were similar for c-sections and vaginal births (see Downloadable Data).
There is considerable evidence that lower payment rates in FFS Medicaid have implications for access to care, including a higher probability of being turned away by physicians, and that birthing people with Medicaid coverage have meaningfully different experiences than birthing people with commercial insurance in terms of health care use and choice of care. The data we present here are a call for a more in-depth understanding of the links between Medicaid and ESI reimbursement, access to health care among birthing people, and outcomes that can be used to inform policy going forward.
In this brief, we examined spending only on the birth itself. We did not include spending on prenatal, postpartum, or newborn care. Payments for childbirth among people with ESI include amounts paid by both the insurer and the patient; we do not include out-of-pocket costs for FFS Medicaid since direct payments for covered services are largely nonexistent. Because Medicaid payments are based on FFS Medicaid only, payment information may not be equally representative across states depending on the percent of Medicaid enrollment in managed care in that state. Our commercial claims are a convenience sample from more than 30 insurers and also vary in how representative they are across states.
Methodology
ESI:
Using diagnostic information, we obtained a sample of more than 400,000 admissions for delivery from 2020 inpatient delivery claims. We defined a delivery admission by the unique combination of individual, diagnostic related group (DRG), and admission and discharge dates. For each admission, we associated all facility claims with professional claims that occurred in the period between admission and discharge dates. We included only claims associated with a female member between the ages of 18 and 45.
We measured spending per admission as the sum of the plan payment and member out-of-pocket costs. We measured the cost per birth as total spending divided by a count of admissions for delivery. For state-level results, we aggregated claims at the state level and reported on states that had data on at least 400 deliveries attributed to at least five providers in 2020, including 100 vaginal birth deliveries and 100 c-section deliveries.
FFS Medicaid:
To the extent possible, we aimed to align methodologies across payers. We examined approximately 1.4 million inpatient stays. Claims had to have an enrollment record with at least one day of eligibility in the month the delivery discharge occurred. We included only enrollees who were female and between the ages of 18 and 45 years old. We excluded all women who were dually eligible for Medicare and Medicaid. Less than one percent of individuals had more than one inpatient childbirth claim during the calendar year; in these cases, we kept all claims and treated each as an independent stay.
The following states were excluded because the count of births in the T-MSIS claims data was more than 50% below the CDC reported Medicaid-covered births in the state: Alabama, Maryland, Mississippi, New Hampshire, New Jersey, Rhode Island, and Tennessee. Note that some states do not reconcile all or some Medicaid presumptive eligibility records, and there may be some variation in the number of records lost due to our data cleaning processes.
For payments, we included inpatient stays where the Medicaid paid amount was greater than $0. We included other non-facility payments that occurred between the start and end date of the index inpatient stay; for the stays without corresponding non-facility payments, we imputed the average non-facility payments at the state level. Additionally, we did not include any amounts paid by Medicare or other third-party payers. DRGs were calculated using ICD-10-CM/PCS MS-DRG v37.0 definitions.
Caution must be used when interpreting the average Medicaid payments made as payments are calculated from non-managed care claims only. Payment information may have varying representativeness across states given that rates of managed care enrollment vary from 0% in Alaska to nearly 100% in Hawaii. States not only have variation in the mix of managed care and fee-for-service beneficiaries, but some services may be carved in or carved out of managed care or care-coordination plans. These arrangements may affect not only the payment data we observe but also potentially the mix of services beneficiaries receive.