The COVID-19 pandemic has resulted in a previously unimaginable impact both in the United States and globally. It is increasingly clear as we enter the fifth month of the pandemic, with rising caseloads and deaths, that the United States will need to continue to address the COVID-19 pandemic for the foreseeable future. Each day, we learn more – about the virus clinically, about the people and communities hardest hit by the virus, and about the social and economic toll the pandemic is expected to take. While the pandemic has exposed the fragility of the US public health surveillance infrastructure, there remain valuable, albeit often disconnected, data resources around the country that can contribute to our collective knowledge of the pandemic’s impact. Using data made available by the COVID-19 Research Database, a cross-industry collaborative contributing real world, de-identified data to researchers wishing to study issues related to COVID-19, we analyze COVID-19 test and antibody positivity rates from a sample of electronic health records in office and clinic settings.
Our findings show that, for our sample population, the disparity in infections among Black and Hispanic communities is significantly higher than most current assumptions. Additionally, we observed that patients presenting in an office or clinic setting who test positive are more likely to be younger and less likely to be older than 65. The findings, based on data from March through June 2020, also showed that patients in New York, New Jersey, and Connecticut were most likely to have tested positive compared to other regions in the United States.
What we know from the literature
Preliminary research at the national level indicates that people of color are more likely to test positive for COVID-19 than white individuals. Two large studies found that Black and Hispanic individuals were up to two and a half times more likely than non-Hispanic white individuals to test positive for COVID-19. In one study, these findings held true “even after accounting for underlying health conditions, other demographics and geographic locations.”
These national findings persist among smaller, more locally focused studies. As of July 2020 in Montgomery County, Maryland, Hispanic residents accounted for more than two-thirds of new infections. A Washington Post analysis of data through May 2020 found that Latinos made up about one third of COVID-19 cases in the District of Columbia, Virginia, and Maryland region, even though they only account for about 10 percent of the population. In Northern Virginia’s Fairfax county, the Washington Post analysis found that Latinos accounted for 64 percent of COVID-19 cases even though they only account for 16.8 percent of the population.
What we found in our analysis: percent of positive tests
This study used data from an ambulatory electronic medical record data platform with data for over two hundred community health centers, primary care, immediate/urgent care, and specialty care providers, and is based on 76,969 COVID tests and 10,998 antibody tests. In our sample of tests administered to patients in these settings, nine percent of COVID tests and seven percent of antibody tests were recorded as positive. For more details on our data and methods please refer to the Methods section.
What we found in our analysis: race and ethnicity
Our analysis supports previous reporting on the disproportionate impact of COVID-19 infections on racial and ethnic minorities. In our sample, Hispanic and Black patients were more likely to test positive for COVID and for COVID antibodies than non-Hispanic white patients were. Figure 1 shows how much more likely Hispanic and Black patients were to test positive compared to white patients. Each dot represents the estimate of how much more or less likely one group of patients is to test positive compared to the reference group of patients (in this figure, white patients are the reference group). Estimates to the left of the vertical dashed line mean the group is less likely to be positive compared to the reference group and estimates to the right of the vertical dashed line mean the group is more likely to be positive compared to the reference group. The width of the horizontal bar indicates the range in certainty of the estimate; if the bar crosses the dashed line, the group did not have a significantly different likelihood of testing positive compared to the reference group. Using this method of analysis allows us to measure the relative strength of the association between testing positive and a patient’s race/ethnicity.
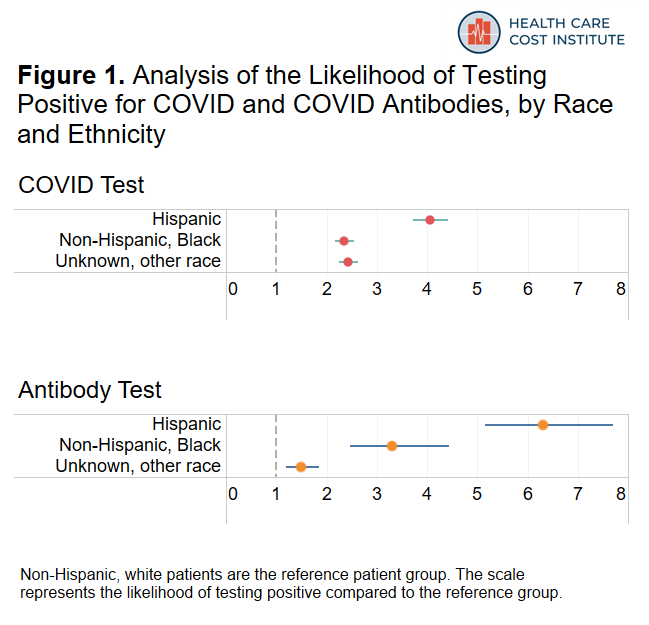
The figure above shows that Hispanic patients were over four times more likely to test positive for COVID and over six times more likely to test positive for antibodies compared to white patients. Moreover, Hispanic patients accounted for 16 percent of COVID tests, but represented almost half of positive COVID tests. Similarly, they accounted for 11 percent of antibody tests but 51 percent of positive antibody tests. Black patients were also over twice as likely to test positive for COVID and over three times more likely to test positive for antibodies compared to tests for non-Hispanic white patients.
What we found in our analysis: geography
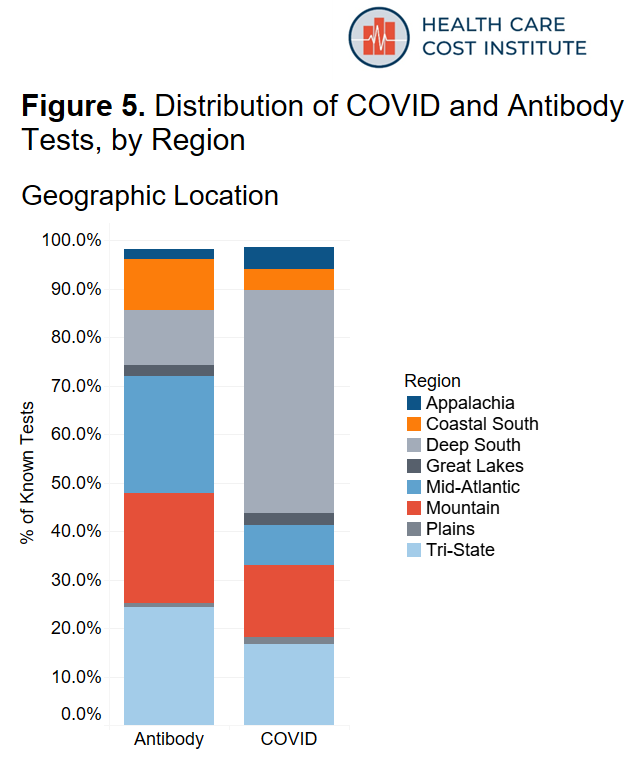
We aggregated our location data into 10 U.S. regions and assigned each patient to a region based on their state of residence. A list of states by region can be found in the methods section at the bottom of the page. Figure 2 shows the distribution of both COVID and antibody testing by region. The data in our sample are concentrated in the New York “Tri-State” area (New York, New Jersey, and Connecticut) the Mountain states (Utah, Colorado, Idaho, Wyoming, Montana), as well as the Deep South (Arkansas, Mississippi, Louisiana, Alabama).
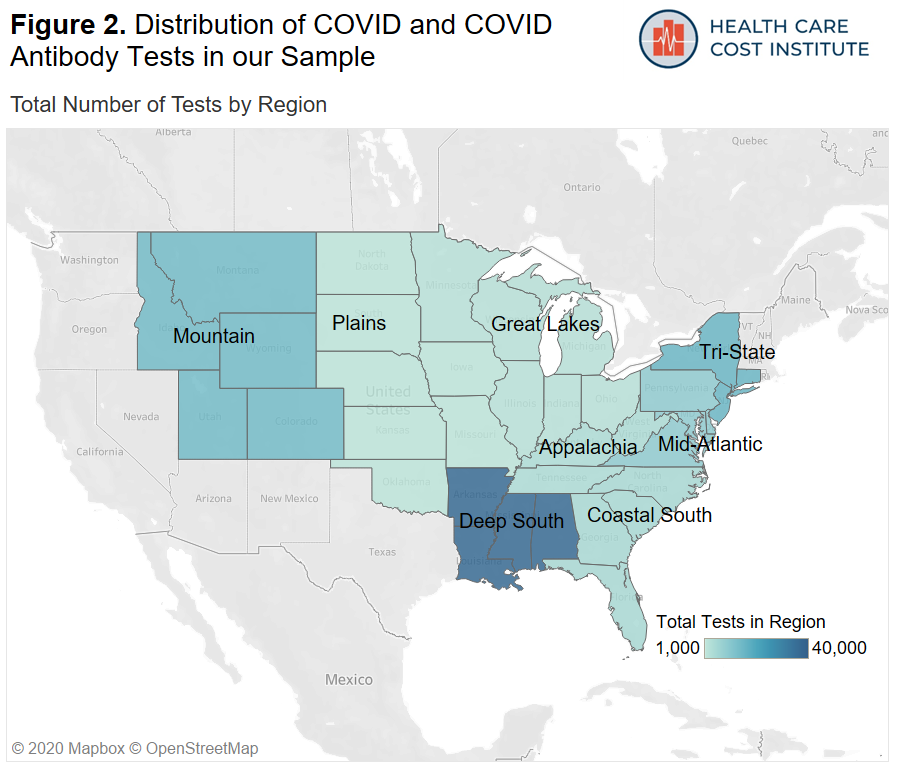
Figure 3 shows how likely COVID tests in each region were to be positive and how likely antibody tests in each region were to be positive compared to states in the Deep South. Note that there was an insufficient amount of data in New England and the Pacific/South West regions to report results in those areas.
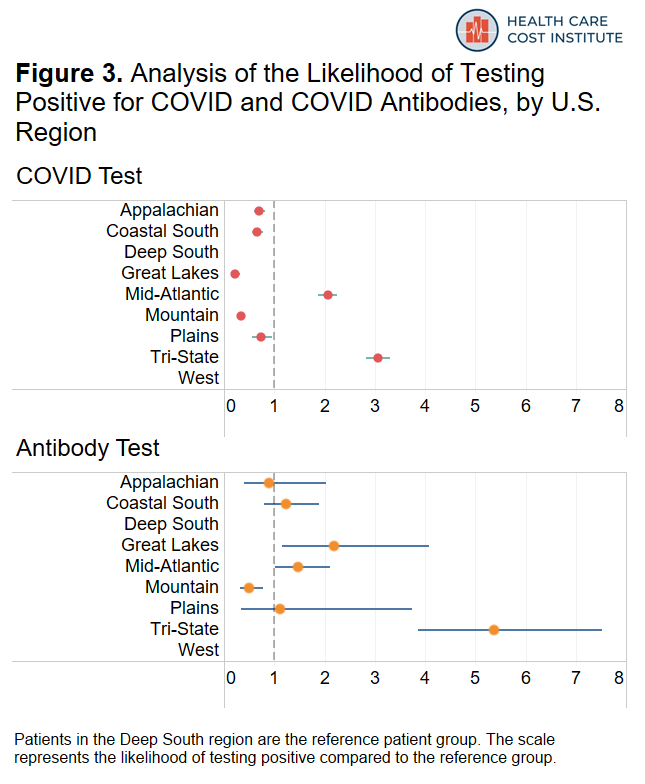
Among the areas included in our dataset, patients in the “Tri-State” region (New York, New Jersey, and Connecticut) were about three times more likely to have a positive COVID test and more than five times more likely to have a positive antibody test than residents of the deep south; this is consistent with reporting that COVID was more prevalent in this region during the time period covered by our data. Patients residing in the Mid-Atlantic region (Pennsylvania, Maryland, Delaware, Virginia, District of Columbia) were twice as likely to have a positive COVID test and forty-seven percent more likely to have a positive antibody test compared to states in the Deep South. As more recent data starts to become available, the geographic patterns we observed here may change.
What we found in our analysis: age and sex
Finally, Figure 4 shows how likely male patients were to test positive compared to female patients and how likely younger and older age groups were to test positive compared to our reference group of patients 35-54 years old.
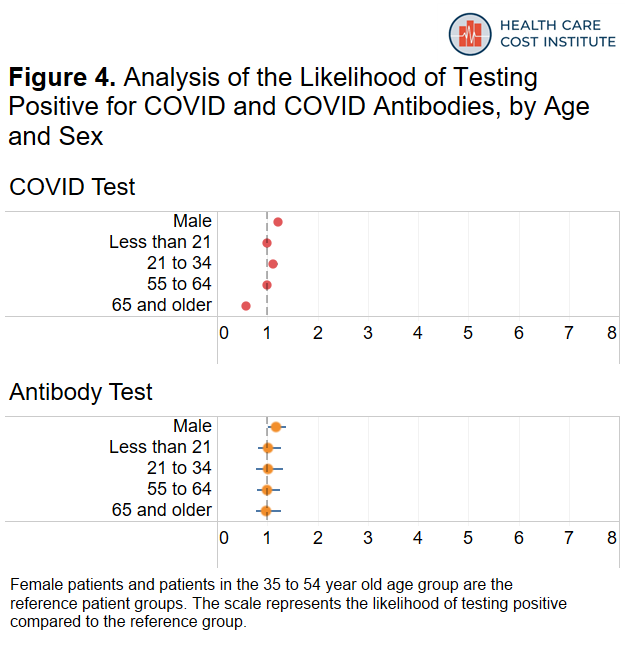
Males were twenty-one percent more likely to test positive for COVID compared to females and eighteen percent more likely to test positive for antibodies compared to females. Patients 21 to 34 years old were twelve percent more likely to test positive for COVID and patients 65 years or older were forty-two percent less likely to test positive for COVID compared to our reference group of patients 35-54 years old.
What this analysis offers: a discussion
This analysis uses data from a convenience sample of electronic medical records to explore reports that Hispanic and Black communities are bearing an undue burden of the COVID-19 pandemic. We find that the experiences of patients in our sample are consistent with those earlier reports. In particular, the disproportionate positivity rate among Hispanic and Black patients within our sample underscores previous reporting that minority communities have been bearing the brunt of the impact of the pandemic. Prevailing theories as to why rates of COVID-19 positive cases are higher in Hispanic communities include higher likelihood of working essential jobs, higher likelihood of living in densely populated housing, or limited access to healthcare and other public support networks. While this analysis is not equipped to assess these other factors that may be associated with increased likelihood of COVID infection, HCCI will continue to use available data to support the understanding of how the pandemic is affecting people, communities, and the health care system with the goal of informing stakeholders to make decisions that mitigate the harm caused by the pandemic.
Methods
We examined laboratory orders from a convenience sample of electronic medical records1 provided by a data management platform vendor with order dates between March 1 and June 30, 2020. Our unit of analysis is a unique “patient laboratory order” + “order date” which means a patient who gets tested more than once on different days may appear in the data more than once. The data cover orders from 3.7 million patients seen by over 200 group practices or clinics for all patients seen by the practice or clinic regardless of payer type. The majority of encounters on the laboratory order were classified as an office visit.
We divided the data into 10 U.S. regions. Table 1 shows the states included in each region and the proportion of data contained in each region. Our sample did not include sufficient data from states in New England and states in the Pacific/South West, so we excluded those regions from the analysis. Figure 5 shows the distribution of COVID and antibody tests by region.
Table 1. Distribution of All Tests Administered (COVID and Antibody) by U.S. Region
| Region | States | Percent Data Distribution |
| Deep South | Arkansas, Mississippi, Louisiana, Alabama | 40 |
| Tri-State | New York, New Jersey, and Connecticut | 18 |
| Mountain | Utah, Colorado, Idaho, Wyoming, Montana | 14 |
| Mid-Atlantic | Pennsylvania, Maryland, Delaware, Virginia, District of Columbia | 11 |
| Costal South | North Carolina, South Carolina, Georgia, Florida | 5 |
| Appalachian | Kentucky, Tennessee, West Virginia | 4 |
| Great Lakes | Michigan, Ohio, Illinois, Minnesota, Indiana, Wisconsin | 3 |
| Plains | North Dakota, South Dakota, Kansas, Oklahoma, Missouri, Nebraska, Iowa | 3 |
| Pacific/South West | California, Oregon, Washington, Hawaii, Alaska, Nevada, Arizona, New Mexico, Texas | 1 |
| New England | Massachusetts, Maine, New Hampshire, Vermont, Rhode Island | <1 |
Using a series of regular expression queries, we searched for two types of tests that are used to determine COVID-19 infection. We identified 93,039 nasopharyngeal tests (“COVID test”) that are used to determine whether a patient currently has the virus that causes COVID-19, and we identified 14,576 blood serum antibody tests (“antibody test”) that are used to help determine if a patient has previously been infected with the virus that causes COVID-19. Key search terms were compiled from a list of COVID-19 PCR and COVID-19 antibody test descriptions at the FDA, and can be found here. After excluding the unknown test results, we retained 76,969 COVID tests and 10,998 antibody tests. This represents a positive rate of 11 percent and 9 percent for COVID and antibody tests, respectively. Figure 6 shows the distribution of all tests with a known result, by demographic characteristic. Table 2 shows the percent of positive results by demographic characteristic. Note, the percent positive is based on the number of positive tests among all tests with a known result.
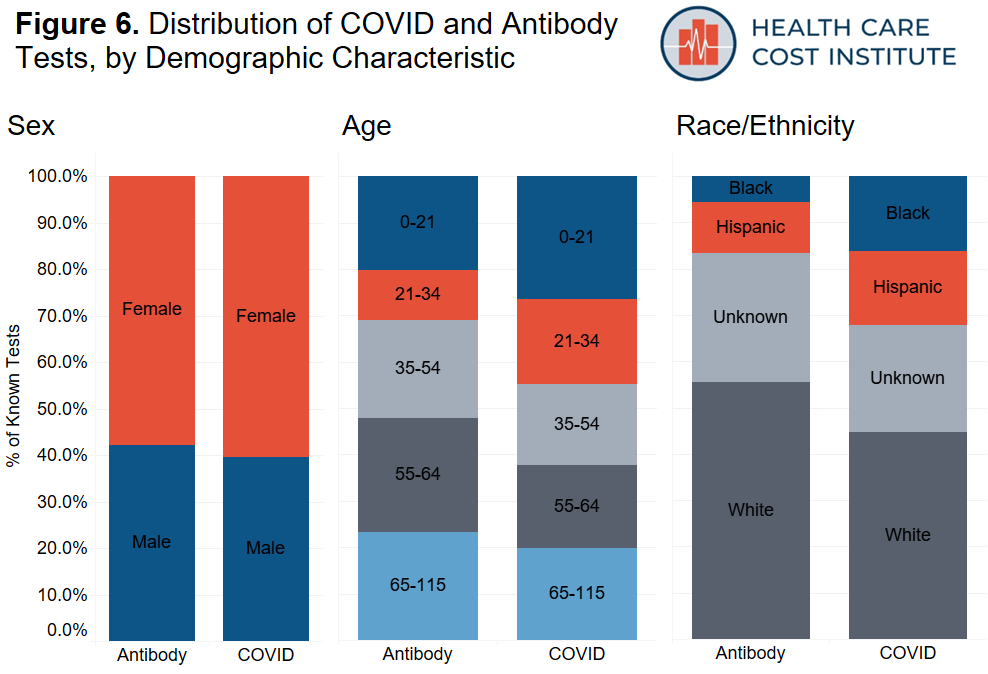
Table 2. COVID and Antibody Test Results with Known Results by Demographic Characteristic
| Characteristic | N | COVID Test (N=76,969) Percent Positive | Antibody Test (N=10,998) Percent Positive |
| Total | 87,967 | 11 | 9 |
| Sex | |||
| Female | 52,822 | 11 | 9 |
| Male | 35,145 | 12 | 9 |
| Age | |||
| Less than 21 | 22,616 | 13 | 12 |
| 21 to 34 | 15,328 | 13 | 11 |
| 35 to 54 | 15,691 | 13 | 9 |
| 55 to 64 | 16,539 | 11 | 7 |
| 65 and older | 17,793 | 5 | 6 |
| Race and Ethnicity | |||
| Non-Hispanic, white | 40,255 | 5 | 4 |
| Non-Hispanic, Black | 13,069 | 11 | 13 |
| Hispanic | 13,603 | 34 | 41 |
| Unknown, other | 21,040 | 9 | 5 |
We used a pair of logistic regressions to model the likelihood of a COVID test being positive and the likelihood of an antibody test being positive, adjusting for age, sex, race and ethnicity, and region of the country. Table 3 shows the results from the models. The odds ratios below represent the exponentiated coefficients of the models; we include the 95% confidence interval in parentheses. Models were run using the logit model procedure from SAS (SAS Institute, Carry, NC). The concordance statistics from the COVID model and the antibody model were 0.785 and 0.824, respectively, indicating a good to strong model fit.
Table 3. Results from Logistic Regression Models
| Characteristic | COVID Model OR (95% CI) | Antibody Model OR (95% CI) |
| Sex | ||
| Female | Ref | Ref |
| Male | 1.21 (1.15 – 1.27) | 1.18 (1.02 – 1.38) |
| Age | ||
| Less than 21 | 1.00 (0.93 – 1.07) | 1.02 (0.82 – 1.28) |
| 21 to 34 | 1.12 (1.04 – 1.21) | 1.01 (0.77 – 1.31) |
| 35 to 54 | Ref | Ref |
| 55 to 64 | 0.99 (0.91 – 1.07) | 0.99 (0.79 – 1.25) |
| 65 and older | 0.58 (0.53 – 0.64) | 0.98 (0.77 – 1.28) |
| Race and Ethnicity | ||
| Non-Hispanic, white | Ref | Ref |
| Non-Hispanic, Black | 2.35 (2.17 – 2.55) | 3.30 (2.46 – 4.43) |
| Hispanic | 4.06 (3.72 – 4.42) | 6.31 (5.16 – 7.71) |
| Unknown, other | 2.43 (2.25 – 2.62) | 1.49 (1.19 – 1.86) |
| Region | ||
| Deep South | Ref | Ref |
| Appalachian | 0.70 (0.60 – 0.81) | 0.89 (0.40 – 2.02) |
| Costal South | 0.65 (0.55 – 0.78) | 1.23 (0.79 – 1.90) |
| Great Lakes | 0.22 (0.16 – 0.31) | 2.18 (1.16 – 4.08) |
| Mid-Atlantic | 2.06 (1.88 – 2.25) | 1.47 (1.02 – 2.11) |
| Mountain | 0.34 (0.30 – 0.34) | 0.49 (0.31 – 0.77) |
| New England | NA | NA |
| Plains | 0.73 (0.55 – 0.96) | 1.12 (0.34 – 3.74) |
| Tri-State | 3.06 (2.83 – 3.30) | 5.38 (3.86 – 7.52) |
| Pacific/South West | NA | NA |
| Model Fit Statistics | ||
| c-statistic | 0.785 | 0.824ORs in bold are significant |
* ORs in bold are significant
Finally, below we include a detailed list of the limitations of our analysis:
- The use of a convenience sample and the lack of a sufficient amount of data in certain regions of the country limits the generalizability of the findings and may bias the results.
- This sample only includes people accessing regular medical care in an office or clinic setting, and with the availability of testing outside a typical office setting (e.g. drive-in testing), we may be biasing the results to those with certain forms of insurance, particularly with Medicaid, Medicare, or those that have insurance through their work.
- There are several important factors that we were unable to control for, including urbanicity of the provider, patient language preference, income, safety net benefits, living situation, insurance status, and employment status.
- The lack of the availability of testing in the U.S. during our study period may bias the results since not everyone seeking out testing was able to get tests, and tests were reserved for the most probable cases at the time.
- This analysis likely includes patients who present (at least initially) with mild to moderate symptoms, it likely does not include information on severe cases who are most likely to show up in the inpatient setting.
- Race and ethnicity data are difficult to collect and may be subjectively entered into the record; additionally, our race/ethnicity data have a high proportion of unknowns (23 percent among COVID Tests and 30 percent among antibody tests), which may bias our results.
- Our analysis includes a discrete four-month period; we don’t use more sophisticated methods to account for variation over time.
1Electronic medical record (EMR) data including diagnosis, procedures, labs, vitals, medications and histories sourced from a data management platform vendor with EMR data on 40 million unique patients, updated daily. The data, technology, and services used in the generation of these research findings were generously supplied pro bono by the COVID-19 Research Database partners, who are acknowledged at https://covid19researchdatabase.org/.