Congress is considering legislation to address “surprise bills”, which occur when a person visits an in-network facility, but receives services from a provider that is outside of their insurer’s network. Bills in both the House and Senate include provisions to determine a benchmark rate for out-of-network payments based on what in-network providers of the same specialty are paid for delivering similar services in the geographic region. To understand the impact of potential legislation, two pieces of information are helpful:
- How much are in-network providers paid for delivering similar services?
- How often do surprise bills occur?
To address the first question, we previously presented data comparing the average commercial and Medicare rates for anesthesia, emergency room, and radiology services performed by in-network providers by state and CBSA. In this analysis, we look at how often services are delivered by an out-of-network provider at an in-network facility across several specialties, by state, using Health Care Cost Institute claims data for individuals with employer-sponsored insurance in 2017.
Specifically, we examined visits for anesthesia, behavioral health, cardiovascular, emergency, pathology, radiology, and surgery services delivered by providers of the same specialty in 2017. We grouped all claims for the same type of service delivered to the same patient on the same day together into a “visit”. We then determined the share of those visits that included at least one claim for an out-of-network provider. We then estimated the potential “surprise bill”, by calculating the difference between the charges and allowed amounts on the out-of-network claims included in the visit.
Key Findings:
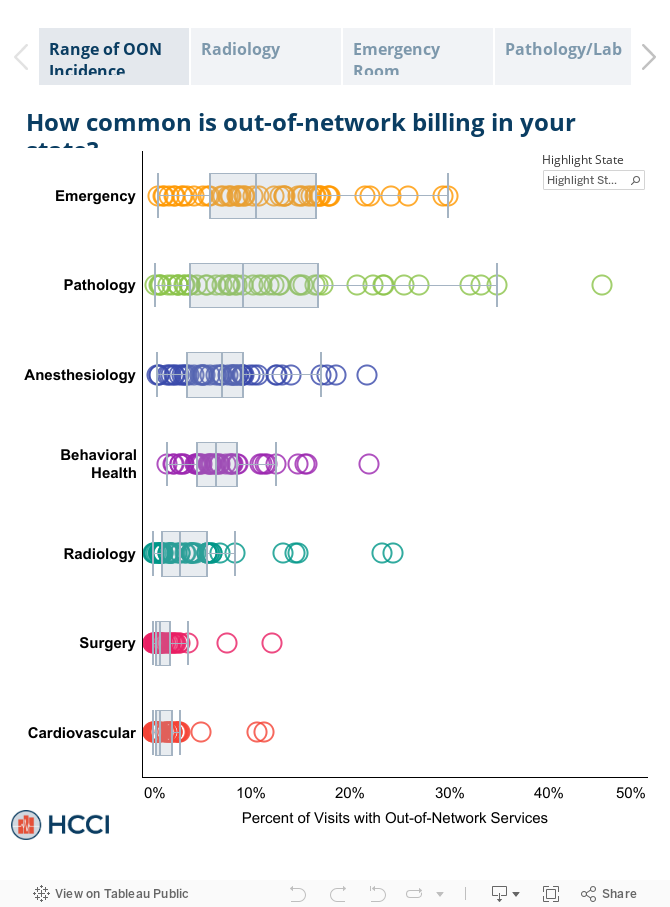
The frequency of out-of-network bills varies by type of service. In 2017, nationally:
- 16.5% of visits with emergency room services had an out-of-network claim from an emergency medicine specialist.
- 12.9% of visits with lab/pathology services had an out-of-network claim from a pathologist.
- 8.3% of visits with anesthesiology services had an out-of-network claim from an anesthesiologist.
- 6.7% of visits with behavioral health services had an out-of-network claim from a behavioral health provider.
- 4.2% of visits with radiology services had an out-of-network claim from a radiologist.
- 2.1% of visits with surgical services had an out-of-network claim from a surgeon.
- 2.0% of visits with cardiovascular services had an out-of-network claim from a cardiovascular specialist.
Variation across states differs by type of service
- Pathology and emergency services had the largest variation.
- Cardiovascular and surgery services had the the smallest variation.
Potential surprise bills for surgery visits are orders of magnitude larger than for other types of service.
- Nationally, the average potential surprise bill associated with an inpatient surgery was $22,248; outpatient surgery was $8,493.
You can explore our findings in the dashboard below.
Methods Note
Estimates for the employer sponsor insured (ESI) population are based on 2017 claims data from the Health Care Cost Institute. All costs represent only professional fees – they do not include inpatient or outpatient facility fees. ESI data were restricted to claims where service category and provider specialty were aligned – anesthesia provided by anesthesiologists, radiology provided by radiologist, ER services provided by emergency medicine specialists, etc. ESI data were further restricted by place of service and only include professional services performed in inpatient hospitals, outpatient hospital departments (on or off campus), emergency departments, and other specialty specific facilities. Data were suppressed according to HCCI masking rules based on the number of procedures performed at a given level of reporting.