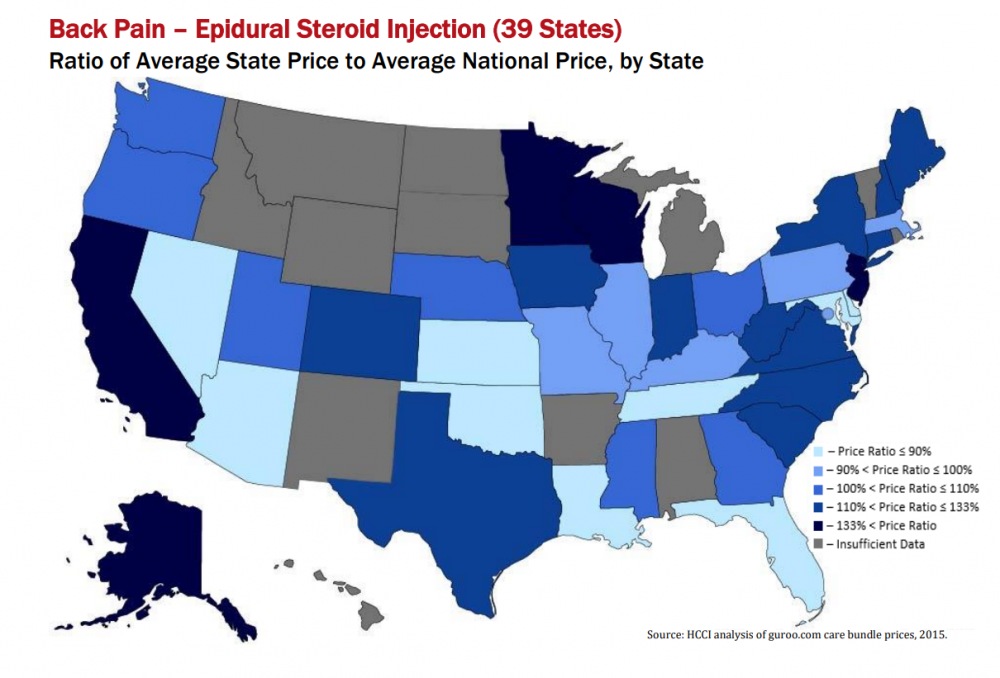
The National Chartbook of Health Care Prices – 2015 and accompanying Health Affairs article “Prices For Common Medical Services Vary Substantially Among the Commercially Insured” illuminates differences in price for over 240 common medical services in 41 states and the District of Columbia.
Among the commercially insured, wide variation in prices have some states paying more than double what other states pay for health care, finds an analysis from the Health Care Cost Institute (HCCI). The study also finds that within states, health care prices can vary threefold. The study, published today as a Web First in Health Affairs, is accompanied by HCCI’s National Chartbook of Health Care Prices—2015, which illuminates differences in prices for over 240 common medical services in 41 states and the District of Columbia.
Compared to the national average, Alaska has the highest average health care prices, followed by Wisconsin, North Dakota, New Hampshire and Minnesota. In New Hampshire and Wisconsin, over 20 percent of health care services are twice the national average price. While in Arizona, Florida, Maryland and Tennessee, over 90 percent of health care services are priced lower than the national average.
Prices vary more for some health care services than others. For example, states have similar prices for acupuncture, while prices for cataract removal vary significantly from state to state. The greatest variation in prices was observed for imaging, radiology and lab tests.
“These data enable policymakers, payers and consumers to see where prices for health care are highest compared to the national average and neighboring states, and begin to explore why these differences exist,” said HCCI Executive Director David Newman. “We hope states use this information to design appropriate solutions to address potentially unnecessary price variation.”
Prices for services also varied widely between cities in the same state. Prices for knee replacements varied most in California, with a $27,243 average price difference between Riverside ($30,261) and Sacramento ($57,504). In Ohio, the average price of a pregnancy ultrasound in Cleveland was almost three times that of Canton ($522 and $183 respectively), even though the two cities are only 60 miles apart.
Variation in prices has a substantial impact on health care spending and patients’ cost sharing. While some price variation can be attributed to differences in wages or rent, the remaining variation is most likely due to differences in underlying market dynamics, such as lack of transparency, market power, or the availability of alternative treatments, say the authors. Reporting on price variation at the service-level can allow us to focus our attention on better understanding the causes.
“We don’t pay for health care, we pay for a physical or an ER visit,” said Eric Barrette, co-author of the study and director of research at HCCI. “By drilling down into the price of individual services, we can better see where prices are higher than average and begin to unpack what is driving those higher prices.”
Nine states were excluded from the report due to lack of sufficient data or because of state statutes that discourage data sharing. The excluded states are Alabama, Hawaii, Idaho, Michigan, Montana, South Dakota, Vermont and Wyoming. Arkansas, which has signaled that it does not want its state data compared to national data, was also excluded.
“Some states data are locked up,” said Newman. “This byzantine behavior stands in the way of efforts to pursue transparency and understand the root causes of rising healthcare spending.”
The reports were developed using HCCI’s large dataset. HCCI holds de-identified Health Insurance Portability and Accountability Act (HIPAA) compliant claims data from three of the nation’s largest health insurance providers. In total, HCCI has claims for 50 million Americans covered by ESI per year. Data for the reports were taken from over 1.8 billion claim lines spanning a two-year period from 2012-2013. All prices reported by HCCI were trended forward to provide more current estimates.
