All HCCI Reports
HCCI’s original reports powered by #HCCIdata
-
National Chartbook of Health Care Prices 2015
 Read more: National Chartbook of Health Care Prices 2015
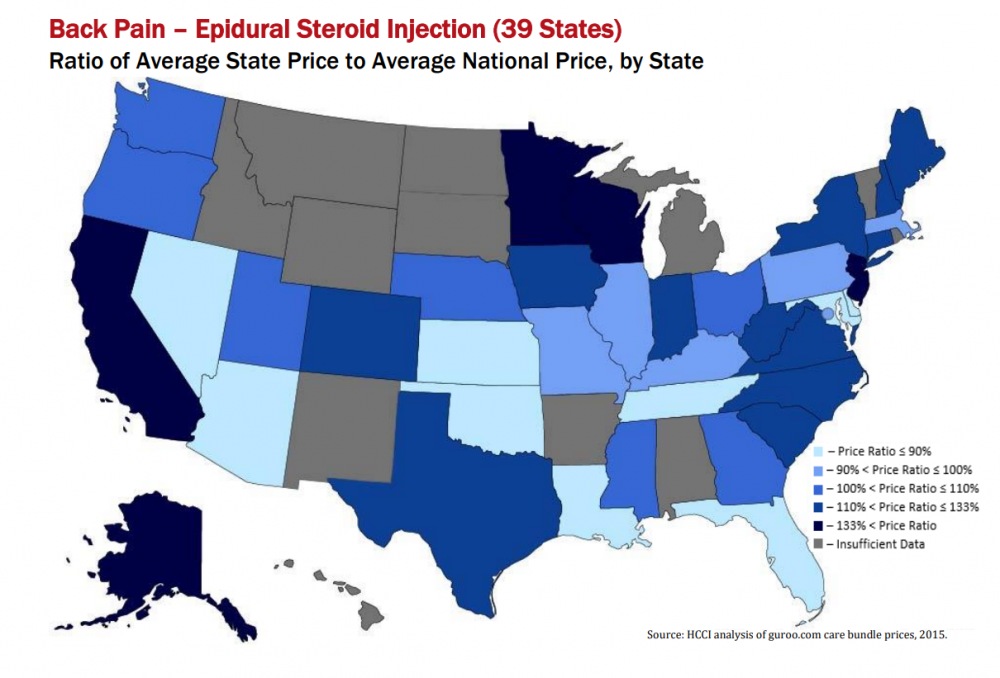
The National Chartbook of Health Care Prices – 2015 and accompanying Health Affairs article “Prices For Common Medical Services Vary Substantially Among the Commercially Insured” illuminates differences in price for over 240 common medical services in 41 states and the District of Columbia. Among the commercially insured, wide variation in prices have some states paying…
-
The Price-Quality Paradox in Health Care
 Read more: The Price-Quality Paradox in Health Care
This data brief compares average state-level prices against quality measures for asthma, diabetes and hypertension care and finds that higher prices for medical services are not always indicative of higher quality of care.
-
Spending on Shoppable Services in Health Care
Read more: Spending on Shoppable Services in Health CareThis issue brief examines health care spending on shoppable services in 2011. Contrary to expectations, giving consumers prices so they can shop for health care services may only have a modest effect on reducing health spending. Key Findings: In 2011, about 43% of the $524.2 billion spent on health care services for commercially insured people…
-
Healthy Marketplace Index – 2015
Read more: Healthy Marketplace Index – 2015The Healthy Marketplace Index is a series of metrics that measure the economic performance of health care markets across the country. The HMI was developed with support from the Robert Wood Johnson Foundation. The Healthy Marketplace Index Report (HMI) shows the economic performance of more than 40 health care markets across the country. Developed by the…
-
Taking the Pulse of Health Care Markets
Read more: Taking the Pulse of Health Care MarketsThis data brief discusses patterns in the price and utilization indices reported in the 2015 Healthy Marketplace Index Report.
-
Children’s Health Spending: 2010-2013
Read more: Children’s Health Spending: 2010-2013Children’s Health Spending: 2010–2013 shows that spending on healthcare for children (ages 0-18) covered by employer-sponsored insurance grew an average of 5.7% per year. The increase in spending in 2013 occurred despite a drop in the use of prescription drugs and visits to the emergency room, demonstrating that rising health care prices were an evident…
-
Per Capita Health Care Spending on Diabetes: 2009-2013
Read more: Per Capita Health Care Spending on Diabetes: 2009-2013This issue brief examines health care spending for adults and children with diabetes relative to those without diabetes, both in terms of total per capita health care spending and out-of-pocket costs from 2009-2013. Key Findings: In 2013, $14,999 was spent per capita on health care for people with diabetes. Per capita health care spending for…
-
Shopping for Health Care Makes “Cents” for Consumers
Read more: Shopping for Health Care Makes “Cents” for ConsumersThis data brief looks at per capita out-of-pocket spending rates nationally and statewide and examines average differences in consumer prices for a set of five common medical procedures: office visit for the evaluation of a new patient, colonoscopy, cataract removal, lower leg MRI; and ultrasound for pregnancy nationally and in nine states: Arizona, Colorado, Florida,…
-
American Journal of Managed Care: Overcoming barriers to a research-ready national commercial claims database
Read more: American Journal of Managed Care: Overcoming barriers to a research-ready national commercial claims databaseABSTRACT Objectives: Billions of dollars have been spent on the goal of making healthcare data available to clinicians and researchers in the hopes of improving healthcare and lowering costs. However, the problems of data governance, distribution, and accessibility remain challenges for the healthcare system to overcome. Study Design: In this study, we discuss some of the…
-
Out-of-Pocket Spending Trends 2013
Read more: Out-of-Pocket Spending Trends 2013This issue brief accompanies the 2013 Spending Cost & Utilization Report and examines trends in out-of-pocket expenditures per capita for the national, younger than age 65 population covered by employer-sponsored insurance for the period of 2011 through 2013.