Annual Reports
-
Children’s Health Services 2020 Report
 Read more: Children’s Health Services 2020 Report
The population with employer-sponsored health insurance (ESI) includes individuals who receive health insurance coverage from an employer, including employees and their dependents, such as spouses and eligible children. Half of the children in the U.S. are covered by ESI, making this form of coverage the largest source of insurance for American children. In this report,…
-
2019 Health Care Cost and Utilization Report
 Read more: 2019 Health Care Cost and Utilization Report
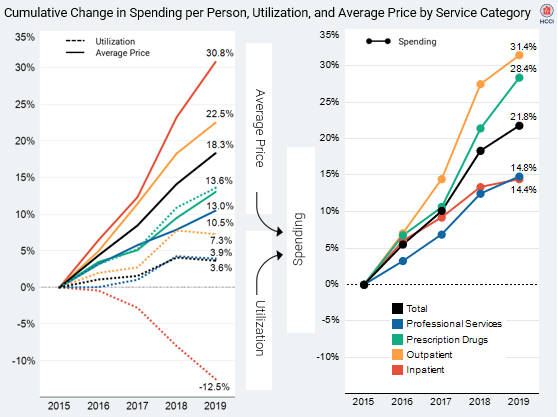
The 2019 Health Care Cost and Utilization Report presents data on health care spending, utilization, and average prices from 2015 through 2019 for individuals under the age of 65 who receive health insurance coverage through an employer. This report examines trends within four categories of service: inpatient admissions, outpatient visits and procedures, professional services, and prescription drugs. All data…
-
2018 Health Care Cost and Utilization Report
 Read more: 2018 Health Care Cost and Utilization Report
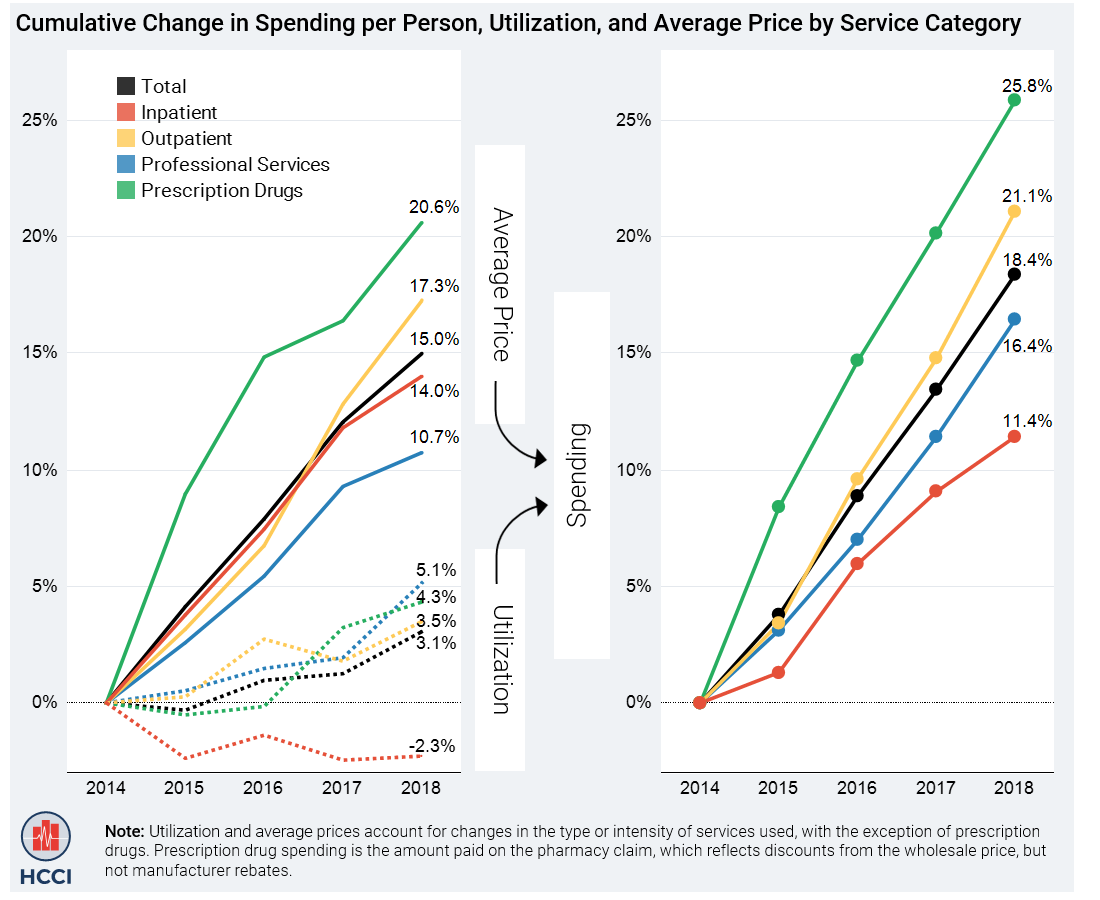
The 2018 Health Care Cost and Utilization Report presents data on health care spending, utilization, and average prices from 2014 through 2018 for individuals under the age of 65 who receive health insurance coverage through an employer. The report draws on data from more than 2.5 billion medical and prescription drug claims for approximately 40…
-
2017 Health Care Cost and Utilization Report
Tags: Drug Spending, HCCUR, Inpatient Spending, Out-of-Pocket, Outpatient Spending, Physician Spending, Prices, Utilization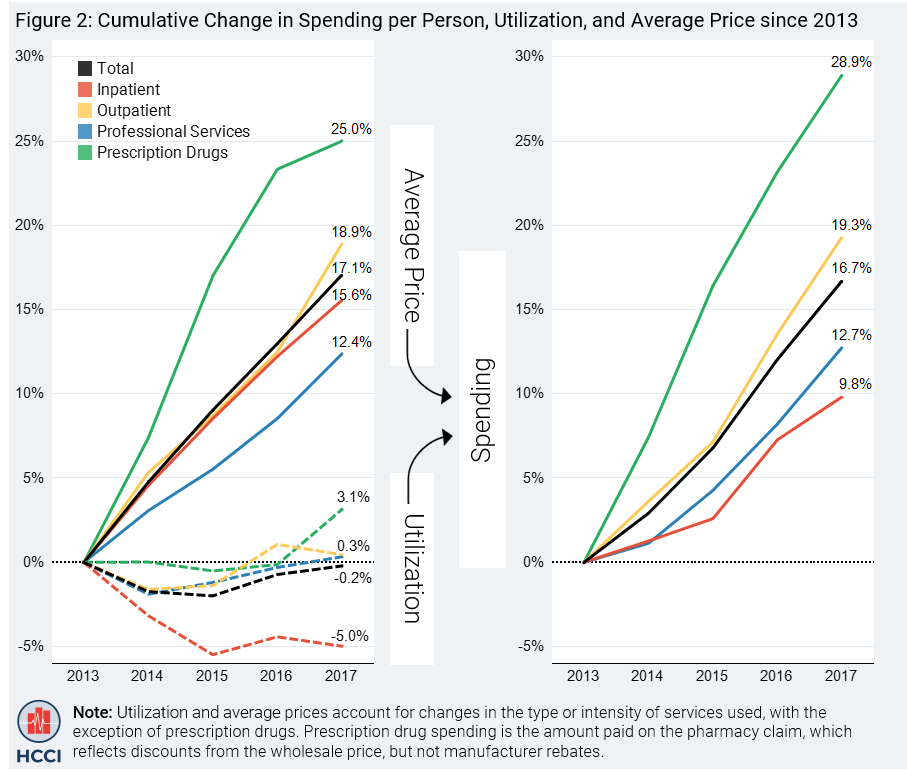 Read more: 2017 Health Care Cost and Utilization Report
The 2017 Health Care Cost and Utilization Report shows that spending per privately insured person grew by 4.2 percent, the second year in a row of spending growth over four percent. Price increases were the primary driver. The report covers the period 2013 through 2017 and includes claims data from four national insurance companies: Aetna, Humana, Kaiser Permanente, and…
-
2016 Health Care Cost and Utilization Report
Tags: Drug Spending, Geographic Variation, HCCUR, Inpatient Spending, Out-of-Pocket, Outpatient Spending, Physician Spending, Prices, Utilization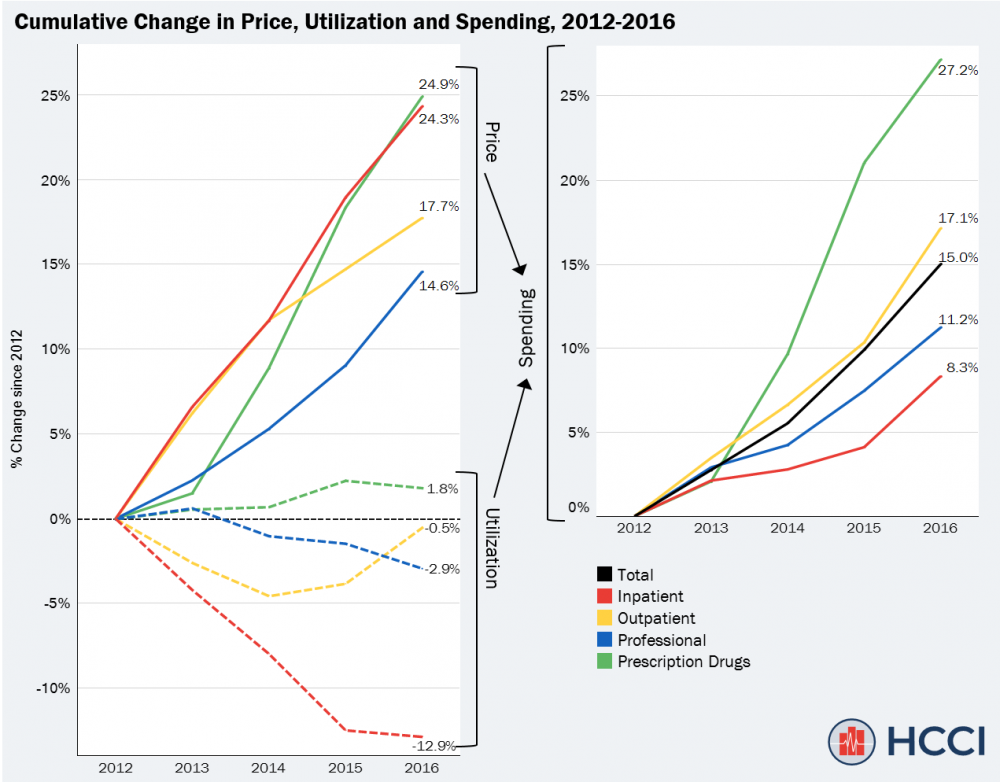 Read more: 2016 Health Care Cost and Utilization Report
The 2016 Health Care Cost and Utilization Report shows that spending per privately insured person grew by 4.6 percent, faster than in previous years. Price increases were the primary driver. The report covers the period 2012 through 2016 and includes claims data from four national insurance companies: Aetna, Humana, Kaiser Permanente, and UnitedHealthcare. The data in…
-
2015 Health Care Cost and Utilization Report
Tags: Commercially Insured, Drug Spending, HCCUR, Inpatient Spending, Outpatient Spending, Physician Spending, Utilization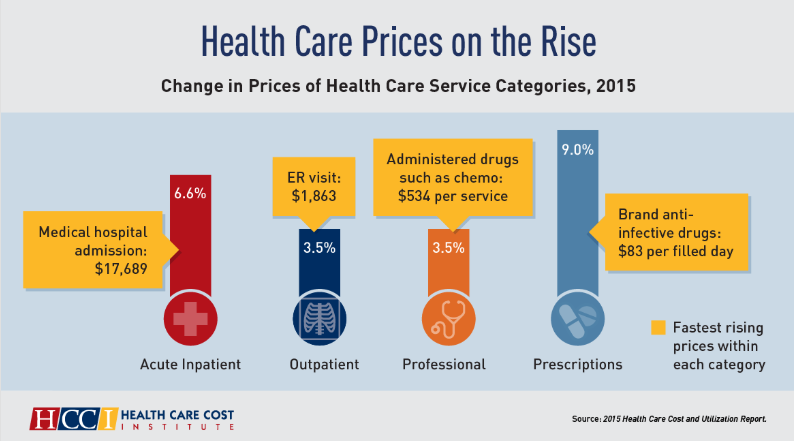 Read more: 2015 Health Care Cost and Utilization Report
The 2015 Health Care Cost and Utilization Report shows that spending per privately insured averaged $5,141 in 2015, up $226 from the year before. Key Findings Health care spending averaged $5,141 per individual in 2015, up $226 from the year before. Out-of-pocket spending rose 3.0 percent in 2015, to an average of $813 per capita….
-
2014 Health Care Cost and Utilization Report
Tags: Commercially Insured, Drug Spending, HCCUR, Inpatient Spending, Out-of-Pocket, Outpatient Spending, Physician Spending Read more: 2014 Health Care Cost and Utilization Report
The 2014 Health Care Cost and Utilization Report tracks changes in health care prices, utilization, and spending for people younger than 65 covered by employer-sponsored health insurance (ESI). The 2014 Health Care Cost and Utilization Report shows that spending per privately insured person grew 3.4% in 2014, with more dollars going to brand-name drugs than…
-
2013 Health Care Cost and Utilization Report
Tags: Commercially Insured, Drug Spending, HCCUR, Inpatient Spending, Out-of-Pocket, Outpatient Spending, Physician SpendingRead more: 2013 Health Care Cost and Utilization ReportThe 2013 Health Care Cost and Utilization Report shows that spending per privately insured grew 3.9% in 2013, as falling utilization offset rising prices. The 2013 Health Care Cost and Utilization Report tracks changes in health care prices, utilization, and spending for people younger than 65 covered by employer-sponsored health insurance (ESI). Key Findings…
-
2012 Health Care Cost and Utilization Report
Tags: Commercially Insured, Drug Spending, Geographic Variation, HCCUR, Inpatient Spending, Outpatient Spending, Physician SpendingRead more: 2012 Health Care Cost and Utilization ReportThe 2012 Health Care Cost and Utilization Report shows that the growth rate of health care spending among privately insured people under age 65 remained low in 2012, growing 4.0 percent, slightly lower than in 2011 (4.1%). Key Findings Spending grew fastest for young adults, women, and people living in the Northeast. Out-of-pocket spending…
-
2011 Health Care Cost and Utilization Report
Tags: Commercially Insured, Drug Spending, HCCUR, Inpatient Spending, Out-of-Pocket, Outpatient Spending, Physician Spending, PricesRead more: 2011 Health Care Cost and Utilization ReportThe Health Care Cost and Utilization Report: 2011 provides the first broad look at 2011 health care spending among those with employer-sponsored insurance (ESI). HCCI found that average dollars spent on health care services for that population climbed 4.6 percent in 2011, reaching $4,547 per person. This was well above the 3.8 percent growth rate…