Publications
-
The Insanity of U.S. Health Care Pricing: An Early Look at Hospital Price Transparency Data
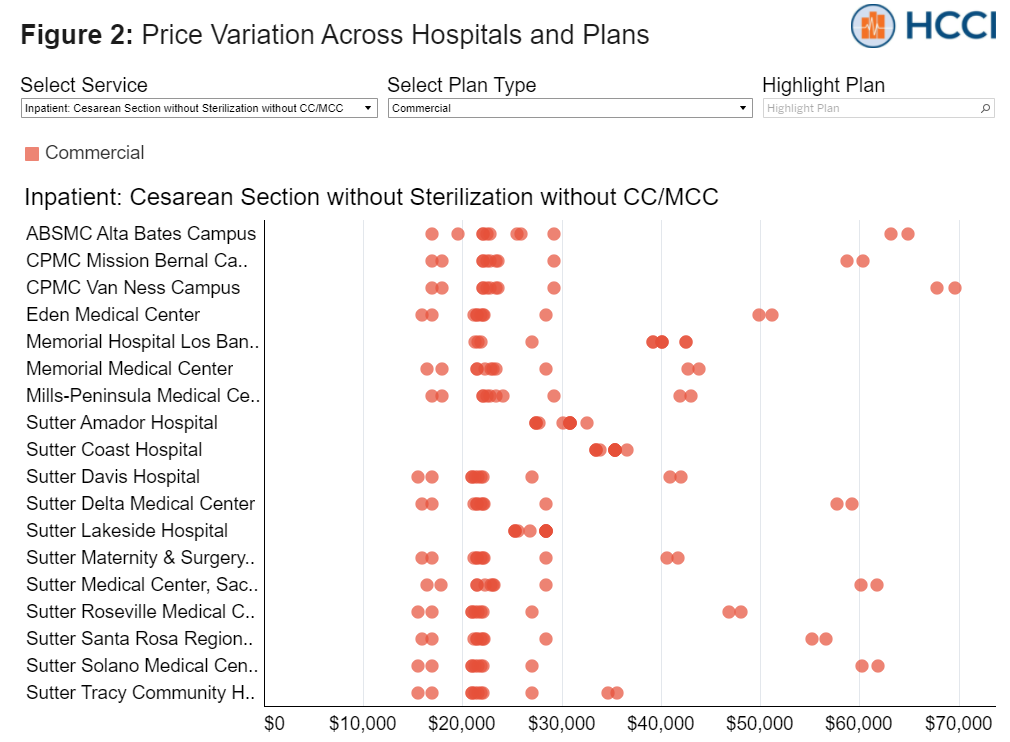 Read more: The Insanity of U.S. Health Care Pricing: An Early Look at Hospital Price Transparency Data
The numbers in this report have been updated to reflect the most recent pricing data made available by Sutter Health. While nearly all of the prices remained unchanged (93%), some, generally higher cost services were revised downward by Sutter. For example, in the initial report we found that C-section prices ranged from $7,634 to $89,244…
-
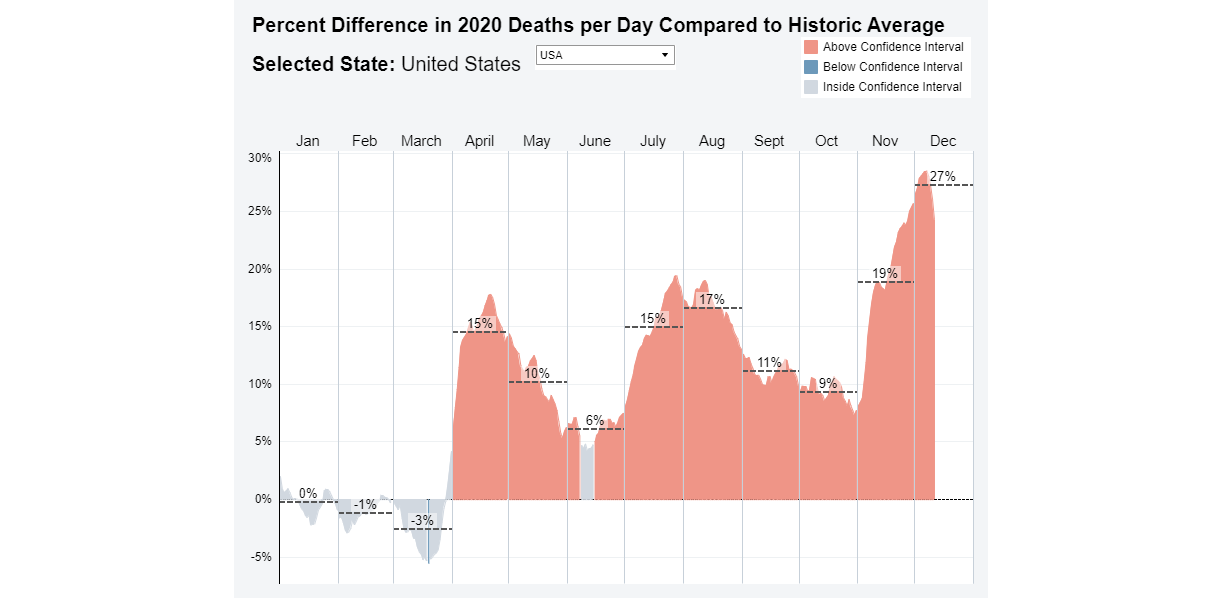
Daily Deaths During Coronavirus Pandemic by State
 Read more: Daily Deaths During Coronavirus Pandemic by State
The staggering death toll of the novel coronavirus pandemic in the United States has been widely reported, surpassing 523,000 as of March 8, 2021. Over the course of the current pandemic a common method for measuring the probable number of deaths caused by COVID-19 has been comparing actual deaths in 2020 to the expected number…
-
Using Medicare Data to Improve Vaccine Targeting: Providers Serving Highest Risk Patients
Tags: COVID-19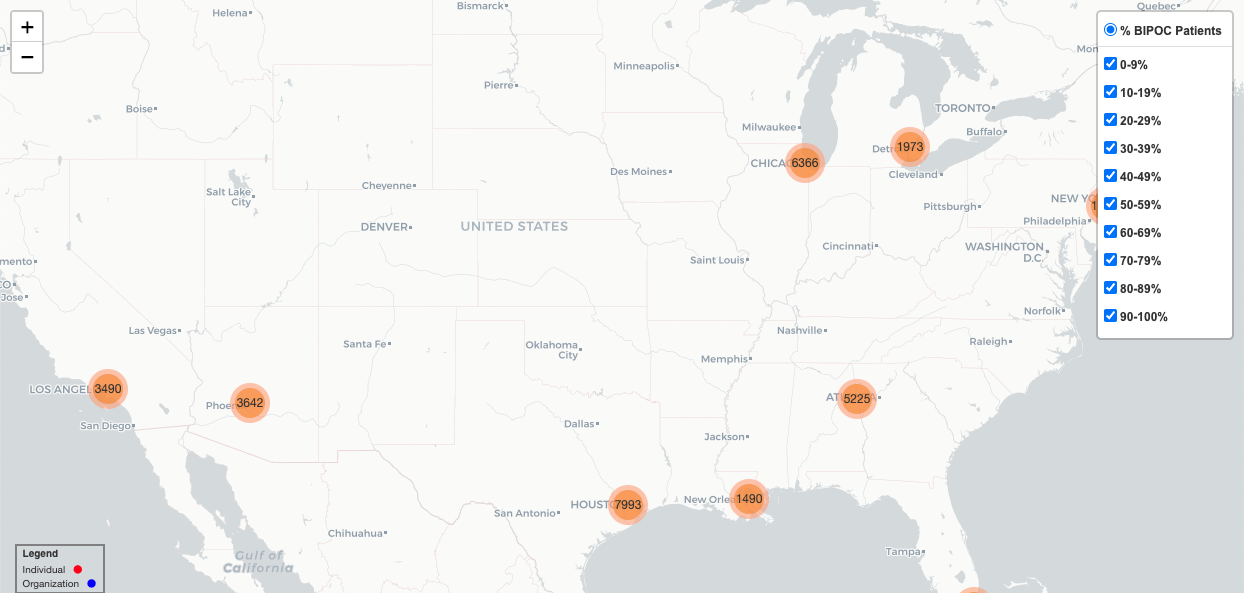 Read more: Using Medicare Data to Improve Vaccine Targeting: Providers Serving Highest Risk Patients
As the production and distribution of SARS-CoV-2 vaccines ramps up in the United States, there is a need to ensure that communities at highest risk for severe COVID-19 morbidity and mortality are targeted. As of February 2021, the Pfizer/BioNTech and Moderna mRNA vaccines, which were approved by the U.S. Food and Drug Administration (FDA) under…
-
COVID-19 Disparities Persist in Community Health Centers’ Vulnerable Populations
Tags: COVID-19 Read more: COVID-19 Disparities Persist in Community Health Centers’ Vulnerable Populations
Community Health Centers (CHCs) serve over 29 million vulnerable patients, making the lack of data on COVID-19-related racial disparities in patients served in CHCs a critical knowledge gap in assessments of the pandemic’s national impact. In rural and poor urban areas, CHCs may be the only accessible healthcare option. Even when other options exist, CHCs…
-
When the Medicare Rate Isn’t the Medicare Rate: Analyzing Differences Between the Medicare Physician Fee Schedule and Payments Received by Physicians.
 Read more: When the Medicare Rate Isn’t the Medicare Rate: Analyzing Differences Between the Medicare Physician Fee Schedule and Payments Received by Physicians.
Increasingly, policymakers are considering proposals that tie payments made by private health insurers, in some way, to rates paid by Medicare. These proposals are inspired by the rising cost of health care and widespread variation in health care prices. For example, we recently found that the cost of the same service can vary by 5-fold,…
-
How Differences Between Commercial, Medicare Professional Service Prices Could Result in Different Policy Impacts
Read more: How Differences Between Commercial, Medicare Professional Service Prices Could Result in Different Policy ImpactsIntroduction As rising health care costs force difficult choices for families, employers, and federal, state, and local governments, a range of policy proposals are emerging to address health care spending in the U.S. In this presidential election year, there has been heightened attention on lowering health care costs and making care more affordable, which will…
-
Past the Healthy Marketplace Index, Volume II: Exploring Changes in Actual Prices Paid for Specific Services by Metro Area from 2013 to 2017
Read more: Past the Healthy Marketplace Index, Volume II: Exploring Changes in Actual Prices Paid for Specific Services by Metro Area from 2013 to 2017In the first brief of the Past the Healthy Marketplace Index series, we explored how prices compared across the country and found that, in 2017, health care prices for specific services varied by as much as 22-fold across metro areas and even up 40-fold within them. In this next brief, we looked at variation in…
-
Past the Healthy Marketplace Index, Volume I: Exploring Actual Prices Paid for Specific Services by Metro Area
Read more: Past the Healthy Marketplace Index, Volume I: Exploring Actual Prices Paid for Specific Services by Metro AreaHow much people spend on health care from place to place reflects multiple, interwoven, and dynamic factors, such as the cost and use of services. Health care spending and its driving factors change over time, differ across geographies, and vary by type of service. The Health Care Cost Institute’s (HCCI) Healthy Marketplace Index (HMI) provides…
-
Electronic Medical Record Data Suggest Disparities in COVID Incidence Persist Across Regions and Over Time
Tags: COVID-19Read more: Electronic Medical Record Data Suggest Disparities in COVID Incidence Persist Across Regions and Over TimeSince the onset of the COVID-19 pandemic, a growing body of research has found alarming disparities in rates of the virus among Black and Hispanic communities. For example, the CDC reports that “American Indian or Alaska Native, Non-Hispanic” people and “Hispanic or Latino” people each have 2.8 times as many COVID cases than white people,…
-
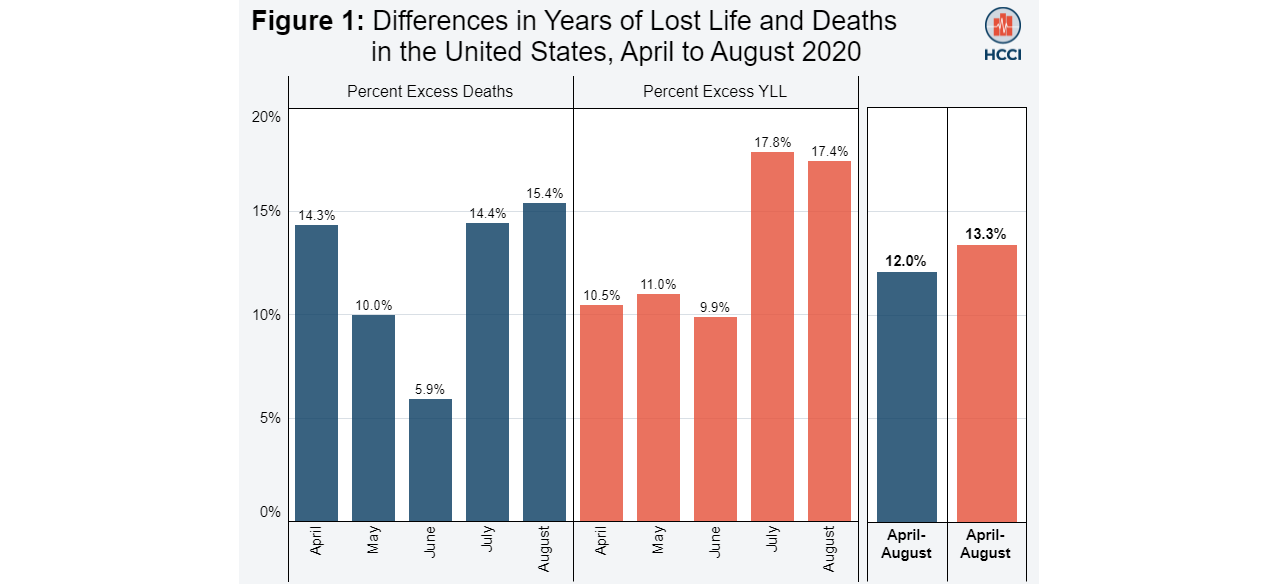
The Impact of COVID-19 on Years of Life Lost
 Read more: The Impact of COVID-19 on Years of Life Lost
Summary: Since April, 1.9 million excess years of life have been lost, 13% above historical average. Over the course of the pandemic, we found age and sex contributions to excess YLL have shifted. Deaths among adults 65 and older accounted for 80% of excess YLL in April but only 36% of excess YLL in June. Since…