Commercially Insured
-
Necessary versus Sufficient Claims Data
 Read more: Necessary versus Sufficient Claims Data
This data brief compares membership characteristics and health care service prices in non-ERISA and ERISA populations. The results suggest that non-ERISA data may be sufficient for policy relevant analyses, even when ERISA data is not available.
-
2014 Diabetes Health Care Cost and Utilization Report
Read more: 2014 Diabetes Health Care Cost and Utilization ReportThe 2014 Diabetes Health Care Cost and Utilization Report examines how much is spent on health care for adults and children with diabetes, where those dollars are spent, and how that compares to people without diabetes. It is based on the health care claims of more than 40 million Americans younger than 65 covered by…
-
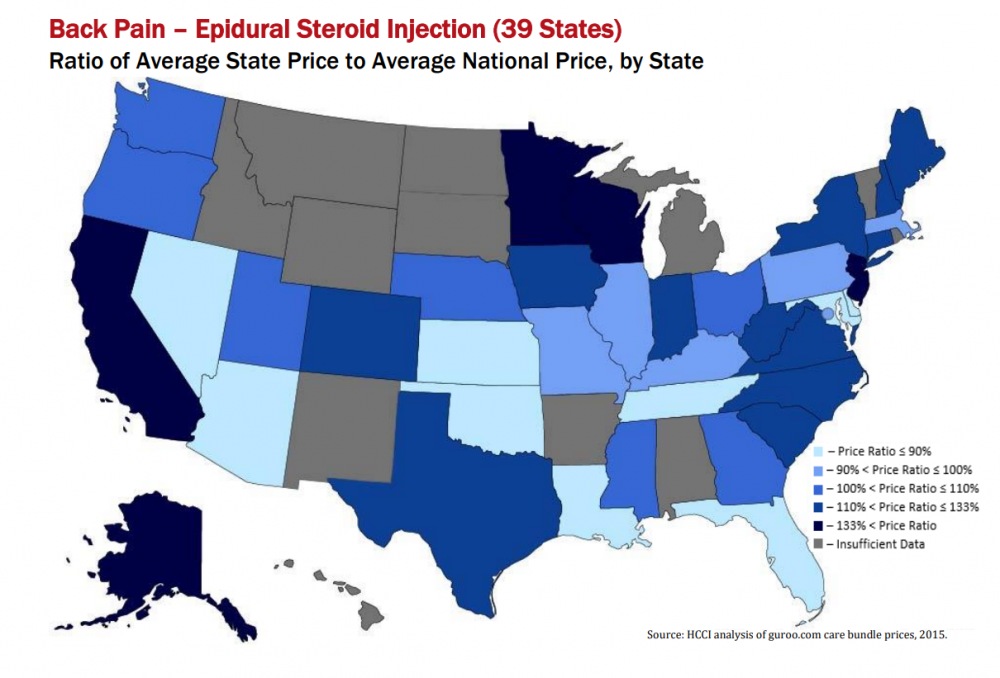
National Chartbook of Health Care Prices 2015
 Read more: National Chartbook of Health Care Prices 2015
The National Chartbook of Health Care Prices – 2015 and accompanying Health Affairs article “Prices For Common Medical Services Vary Substantially Among the Commercially Insured” illuminates differences in price for over 240 common medical services in 41 states and the District of Columbia. Among the commercially insured, wide variation in prices have some states paying…
-
Spending on Shoppable Services in Health Care
Read more: Spending on Shoppable Services in Health CareThis issue brief examines health care spending on shoppable services in 2011. Contrary to expectations, giving consumers prices so they can shop for health care services may only have a modest effect on reducing health spending. Key Findings: In 2011, about 43% of the $524.2 billion spent on health care services for commercially insured people…
-
2014 Health Care Cost and Utilization Report
Tags: Commercially Insured, Drug Spending, HCCUR, Inpatient Spending, Out-of-Pocket, Outpatient Spending, Physician SpendingRead more: 2014 Health Care Cost and Utilization ReportThe 2014 Health Care Cost and Utilization Report tracks changes in health care prices, utilization, and spending for people younger than 65 covered by employer-sponsored health insurance (ESI). The 2014 Health Care Cost and Utilization Report shows that spending per privately insured person grew 3.4% in 2014, with more dollars going to brand-name drugs than…
-
Children’s Health Spending: 2010-2013
Read more: Children’s Health Spending: 2010-2013Children’s Health Spending: 2010–2013 shows that spending on healthcare for children (ages 0-18) covered by employer-sponsored insurance grew an average of 5.7% per year. The increase in spending in 2013 occurred despite a drop in the use of prescription drugs and visits to the emergency room, demonstrating that rising health care prices were an evident…
-
2013 Health Care Cost and Utilization Report
Tags: Commercially Insured, Drug Spending, HCCUR, Inpatient Spending, Out-of-Pocket, Outpatient Spending, Physician SpendingRead more: 2013 Health Care Cost and Utilization ReportThe 2013 Health Care Cost and Utilization Report shows that spending per privately insured grew 3.9% in 2013, as falling utilization offset rising prices. The 2013 Health Care Cost and Utilization Report tracks changes in health care prices, utilization, and spending for people younger than 65 covered by employer-sponsored health insurance (ESI). Key Findings…
-
Out-of-Pocket Spending Trends 2013
Read more: Out-of-Pocket Spending Trends 2013This issue brief accompanies the 2013 Spending Cost & Utilization Report and examines trends in out-of-pocket expenditures per capita for the national, younger than age 65 population covered by employer-sponsored insurance for the period of 2011 through 2013.
-
2007-2011 Vermont Health Care Cost and Utilization Report
Read more: 2007-2011 Vermont Health Care Cost and Utilization ReportThe 2007-2011 Vermont Health Care Cost and Utilization Report compares national and Vermont health care trends for the privately insured. The report finds that Vermonters with employer sponsored health insurance spent less on health care, but their spending grew faster than the national average. The report was prepared in cooperation with the Green Mountain Care Board. Key Findings…
-
Key Findings from Children’s Health Spending 2009-2012 Report
Read more: Key Findings from Children’s Health Spending 2009-2012 ReportThis issue brief summarizes the main findings of the Health Care Cost Institute’s (HCCI’s) Children’s Health Spending: 2009-2012.