Out-of-Pocket
-
2017 Health Care Cost and Utilization Report
Tags: Drug Spending, HCCUR, Inpatient Spending, Out-of-Pocket, Outpatient Spending, Physician Spending, Prices, Utilization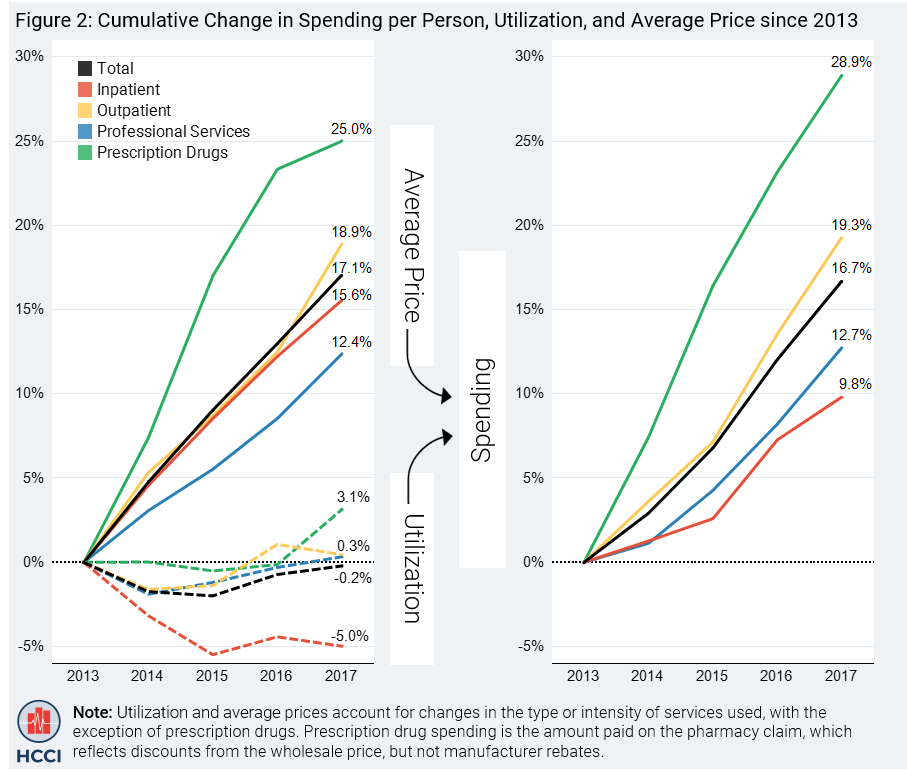 Read more: 2017 Health Care Cost and Utilization Report
The 2017 Health Care Cost and Utilization Report shows that spending per privately insured person grew by 4.2 percent, the second year in a row of spending growth over four percent. Price increases were the primary driver. The report covers the period 2013 through 2017 and includes claims data from four national insurance companies: Aetna, Humana, Kaiser Permanente, and…
-
2016 Health Care Cost and Utilization Report
Tags: Drug Spending, Geographic Variation, HCCUR, Inpatient Spending, Out-of-Pocket, Outpatient Spending, Physician Spending, Prices, Utilization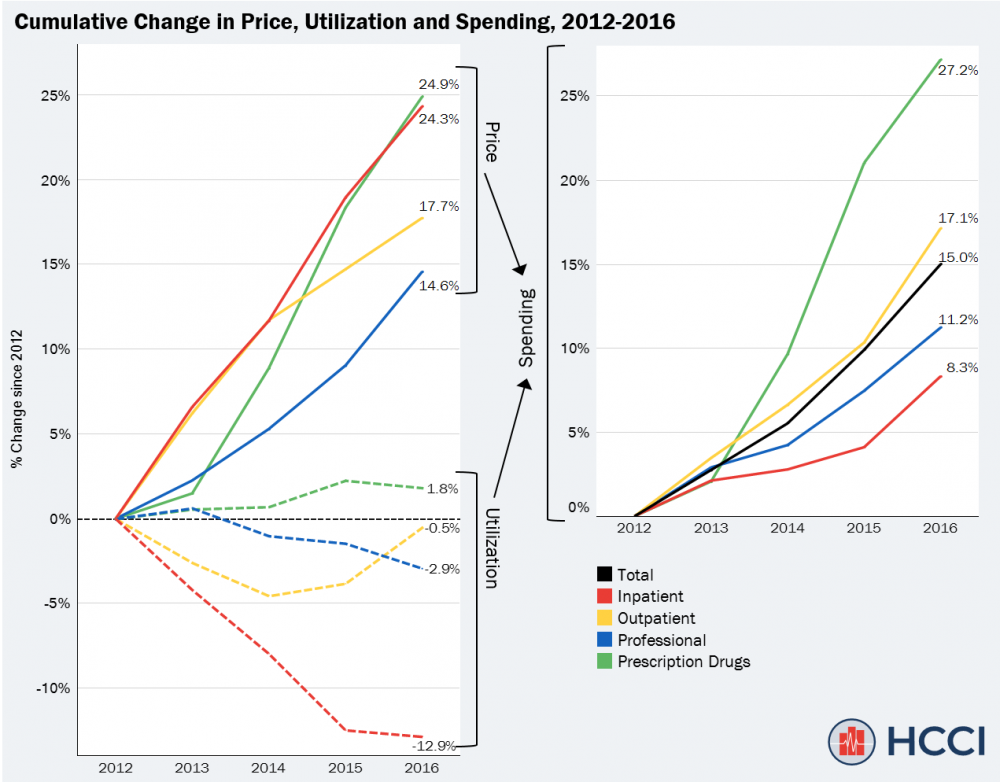 Read more: 2016 Health Care Cost and Utilization Report
The 2016 Health Care Cost and Utilization Report shows that spending per privately insured person grew by 4.6 percent, faster than in previous years. Price increases were the primary driver. The report covers the period 2012 through 2016 and includes claims data from four national insurance companies: Aetna, Humana, Kaiser Permanente, and UnitedHealthcare. The data in…
-
Top Spenders Among the Commercially Insured Increased Spending Concentration and Consistent Turnover from 2013 to 2015
Tags: Commercially Insured, Drug Spending, Inpatient Spending, Out-of-Pocket, Outpatient Spending, Physician Spending, Top Spenders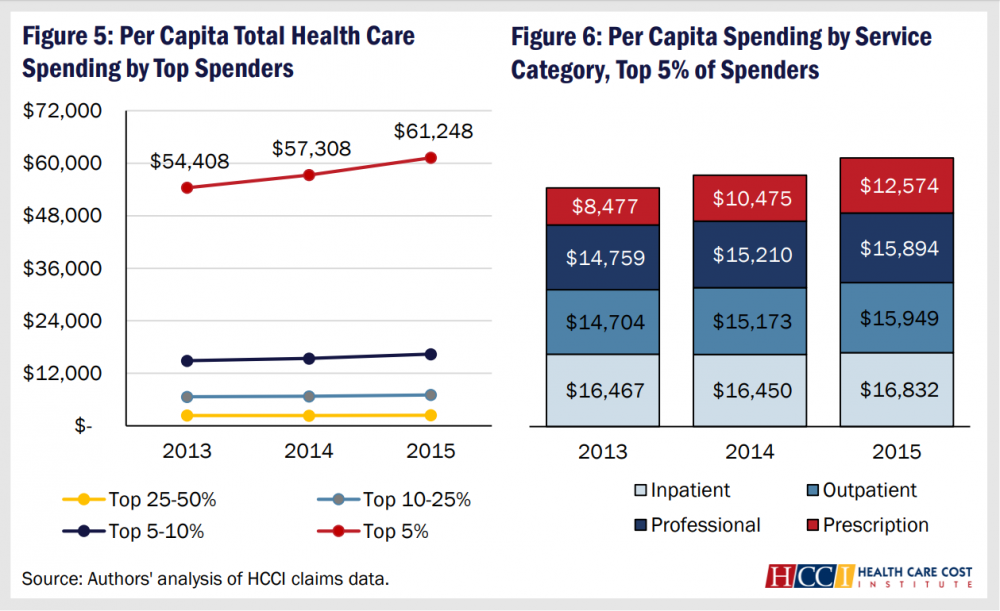 Read more: Top Spenders Among the Commercially Insured Increased Spending Concentration and Consistent Turnover from 2013 to 2015
This issue brief explores the distribution of health care spending among commercially insured individuals, with a focus on the top 5 percent of spenders and turnover within that group from year to year. It considers the share of spending incurred by this group of top spenders, how those dollars are distributed among the health care…
-
Trends in Total and Out-of-Pocket Spending in Metro Areas: 2012-2015
 Read more: Trends in Total and Out-of-Pocket Spending in Metro Areas: 2012-2015
This data brief examines geographic variation in health care per capita spending, with a focus on consumer per capita out-of-pocket spending across geographies (2012-2015). It also explores whether the proportion of people enrolled in consumer-directed health plans (CDHPs) and the proportion not utilizing health care services had any influence on out-of-pocket spending.
-
JAMA Internal Medicine: A Perspective on Out-of-Pocket Spending
Read more: JAMA Internal Medicine: A Perspective on Out-of-Pocket SpendingTo the Editor Understanding out-of-pocket spending is critical to understanding health care costs in the United States. We applaud the efforts of Adrion et al as an important contribution to understanding the out-of-pocket spending of the commercially insured population younger than 65 years. The commercially insured comprise over 50% of the nonelderly US population and, as…
-
Consumer-Driven Health Plans: A Cost and Utilization Analysis
Read more: Consumer-Driven Health Plans: A Cost and Utilization AnalysisThis data brief examines the health care use and spending from 2010-2014 for people who are enrolled in consumer-driven health plans (CDHPs), and compares these trends to non-CDHP enrollees. Findings indicate that although fewer total dollars were spent on health care for CDHP enrollees, they had higher per capita out-of-pocket spending on deductibles, copays, and…
-
Spending on Shoppable Services in Health Care
Read more: Spending on Shoppable Services in Health CareThis issue brief examines health care spending on shoppable services in 2011. Contrary to expectations, giving consumers prices so they can shop for health care services may only have a modest effect on reducing health spending. Key Findings: In 2011, about 43% of the $524.2 billion spent on health care services for commercially insured people…
-
2014 Health Care Cost and Utilization Report
Tags: Commercially Insured, Drug Spending, HCCUR, Inpatient Spending, Out-of-Pocket, Outpatient Spending, Physician SpendingRead more: 2014 Health Care Cost and Utilization ReportThe 2014 Health Care Cost and Utilization Report tracks changes in health care prices, utilization, and spending for people younger than 65 covered by employer-sponsored health insurance (ESI). The 2014 Health Care Cost and Utilization Report shows that spending per privately insured person grew 3.4% in 2014, with more dollars going to brand-name drugs than…
-
Per Capita Health Care Spending on Diabetes: 2009-2013
Read more: Per Capita Health Care Spending on Diabetes: 2009-2013This issue brief examines health care spending for adults and children with diabetes relative to those without diabetes, both in terms of total per capita health care spending and out-of-pocket costs from 2009-2013. Key Findings: In 2013, $14,999 was spent per capita on health care for people with diabetes. Per capita health care spending for…
-
Shopping for Health Care Makes “Cents” for Consumers
Read more: Shopping for Health Care Makes “Cents” for ConsumersThis data brief looks at per capita out-of-pocket spending rates nationally and statewide and examines average differences in consumer prices for a set of five common medical procedures: office visit for the evaluation of a new patient, colonoscopy, cataract removal, lower leg MRI; and ultrasound for pregnancy nationally and in nine states: Arizona, Colorado, Florida,…